Tables are a great way to display your data when you want more details and focus on individual values. You can easily create tables on Tableau by dragging your measures and dimensions.
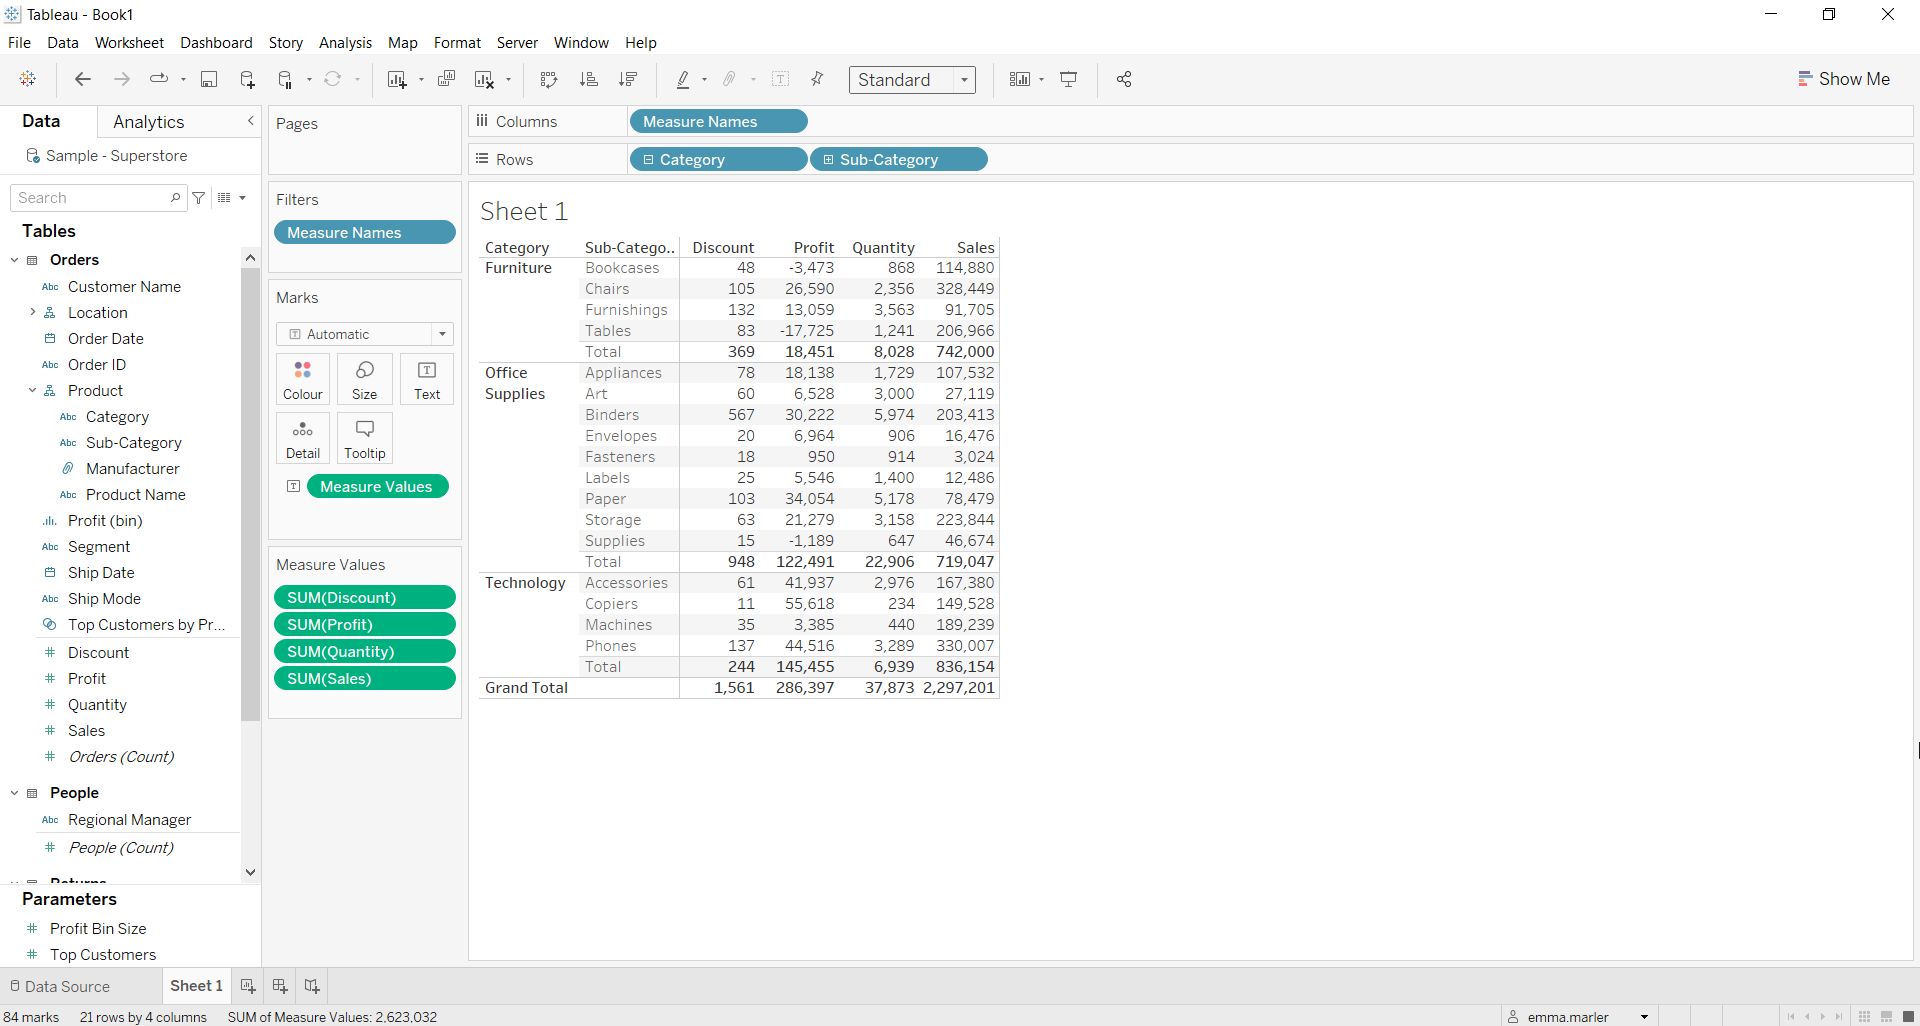
Let us then see how to build step-by-step a table on Tableau. Our goal is to create a table showing different values, such as profit, quantity and sales, per each category and sub-category from the Sample Superstore data.
Step 1. Create a table
- Connect to the data source Sample – Superstore.
- Drag the Category and Sub-Category (that can be found under Product) to the Rows.
- Drag Discount on Label in the Marks card.
- Drag Profit onto the Discount column that has appeared next to Sub-Category on view. Repeat for Quantity and Sales.

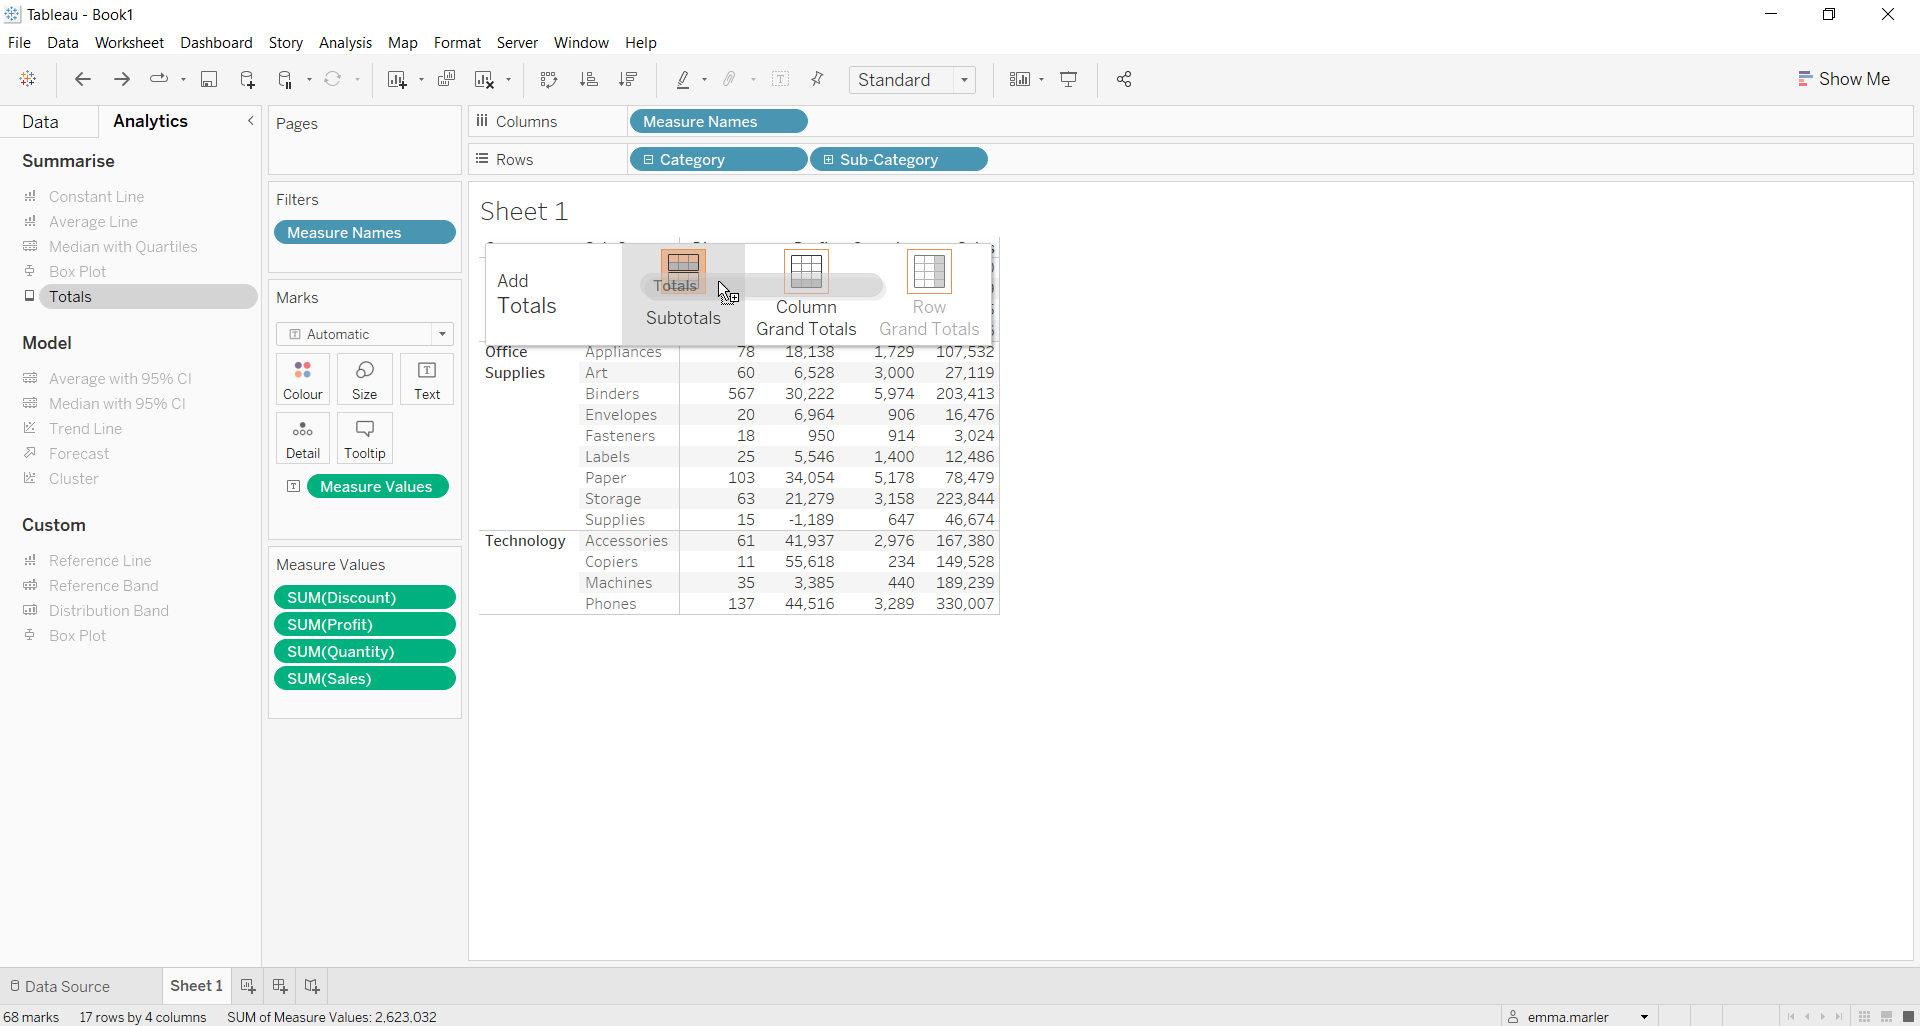
- Go on the Analytics pane on the left, drag Totals on the view and drop it on Subtotals when the box appears.

- Repeat by dragging Totals on Column Grand Totals when the box appears as in step 5.

- Fit to Entire View if you want. Done!
Don’t wait! Contact us to learn more and continue to follow upcoming news on our website and LinkedIn channel.

