Tableau extensions allow you to add exclusive functionalities to your dashboards or integrate them directly with external applications.
Custom Tableau Extensions
tailored to meet specific needs
Discover our successful collaborations with AppsforTableau and Prometeia
Dynamic Dashboard Sync
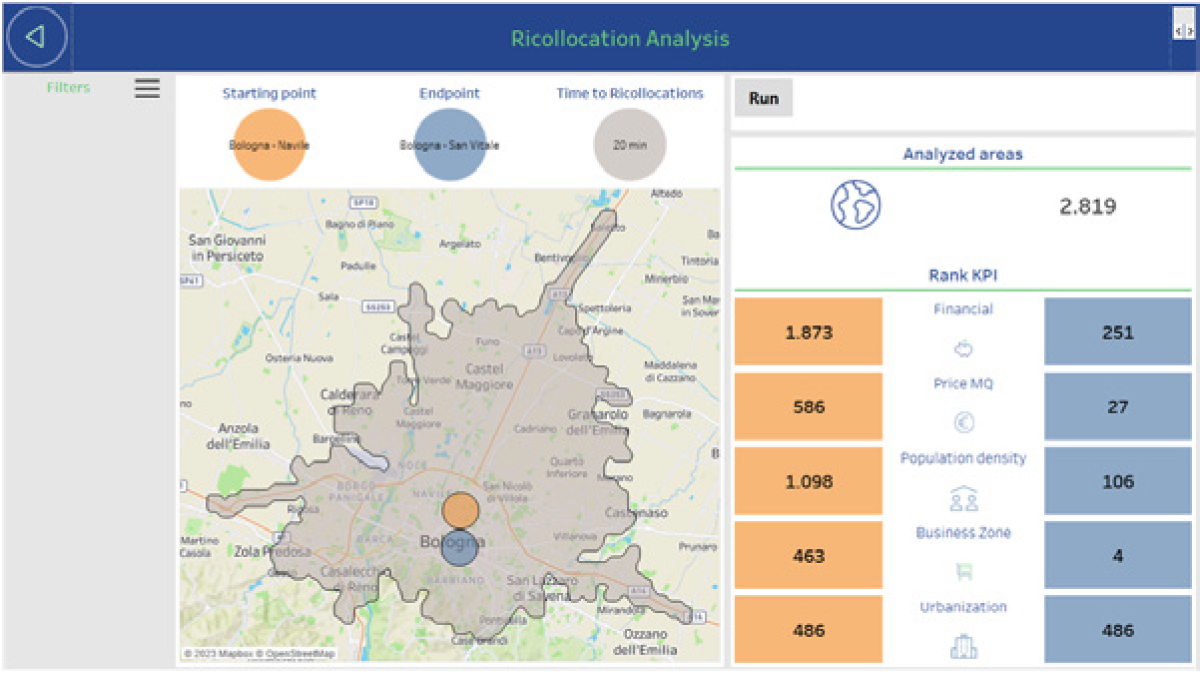
Explore “Dynamic Dashboard Sync” by Tableau, an extension that revolutionizes your data flow, transforming it into a dynamic environment of possibilities! Customize forms and integrate your favorite APIs in any programming language.
Manage your datasource values in real-time, explore various scenarios, and evaluate their impact on key business metrics. This extension becomes your new ally in optimizing strategies and achieving outstanding results. Improve decision-making and data analysis with “Dynamic Dashboard Sync,” turning your data into concrete opportunities for success.
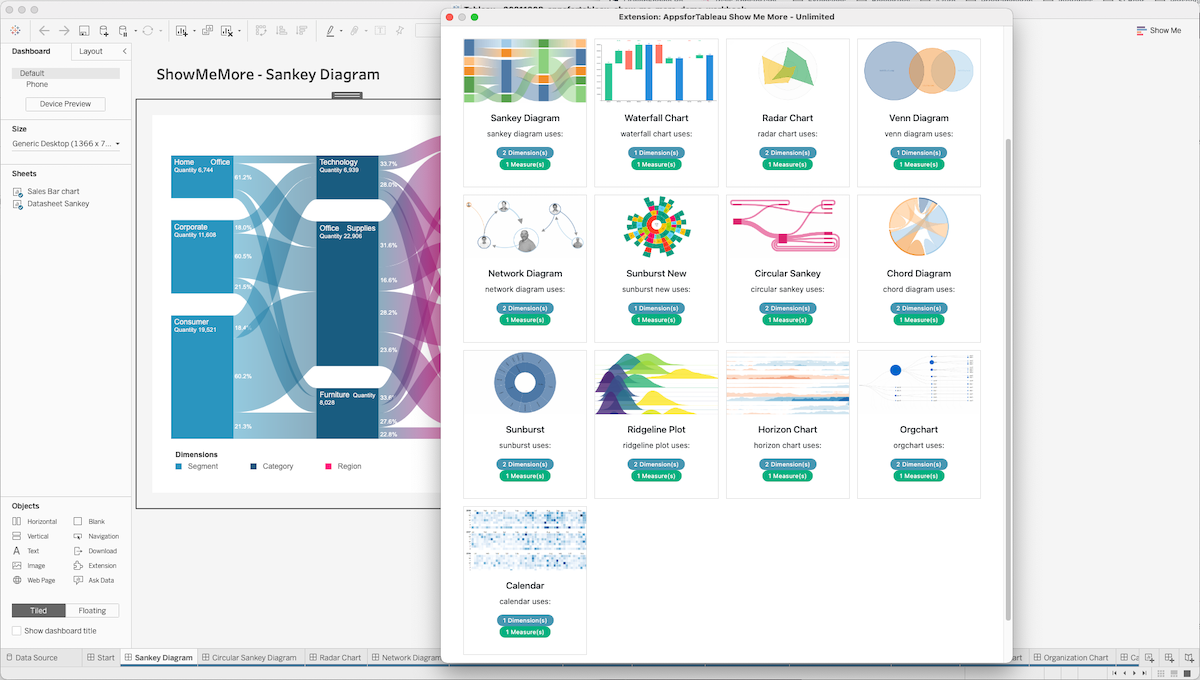
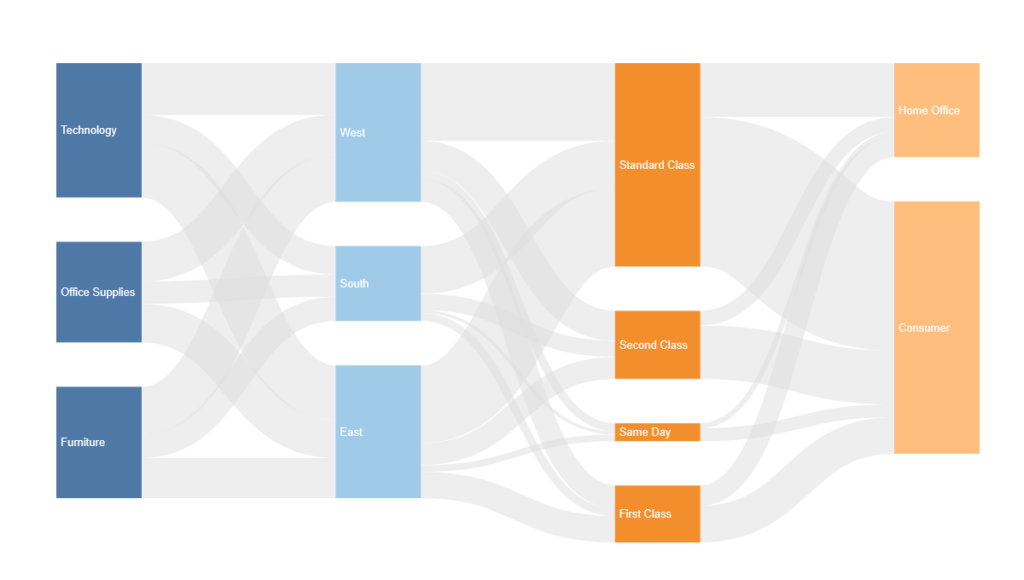
The “Show me More” extension is essential when you need to incorporate visualization types not available in Tableau’s default “Show me” set.
Want to include an interactive Sankey diagram to visualize flows? Need a flexible radar chart for your HR dashboards? With the “Show me More” extension, you can display a dynamic network chart in Tableau dashboards to illustrate your department’s structure.
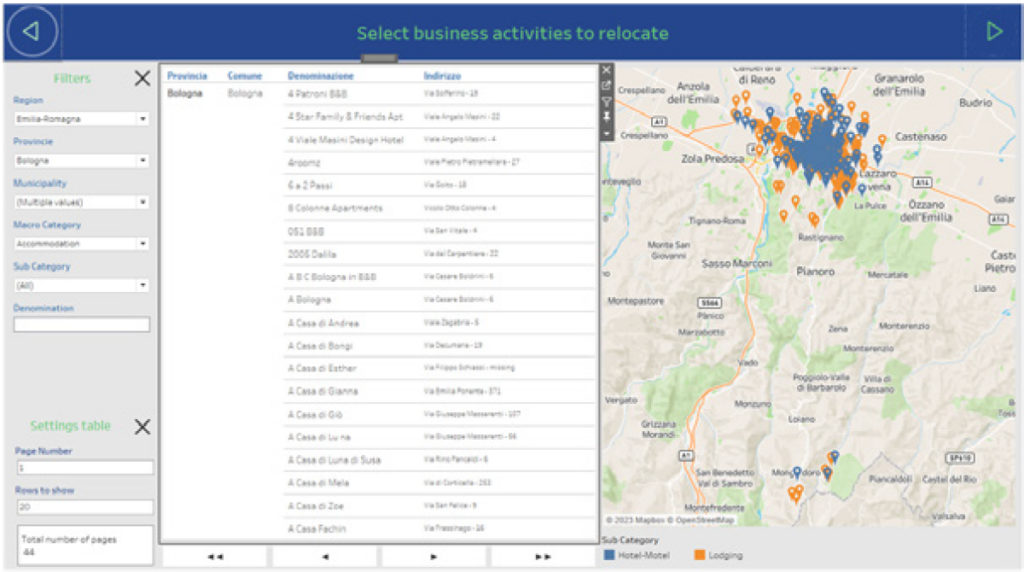
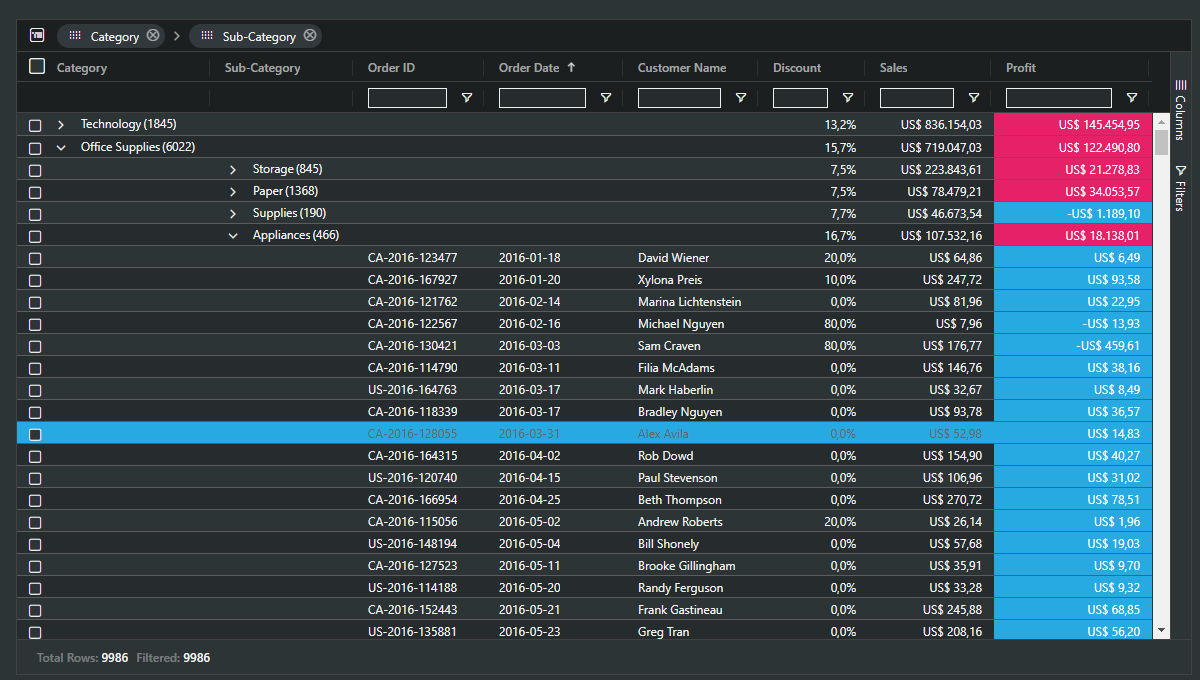
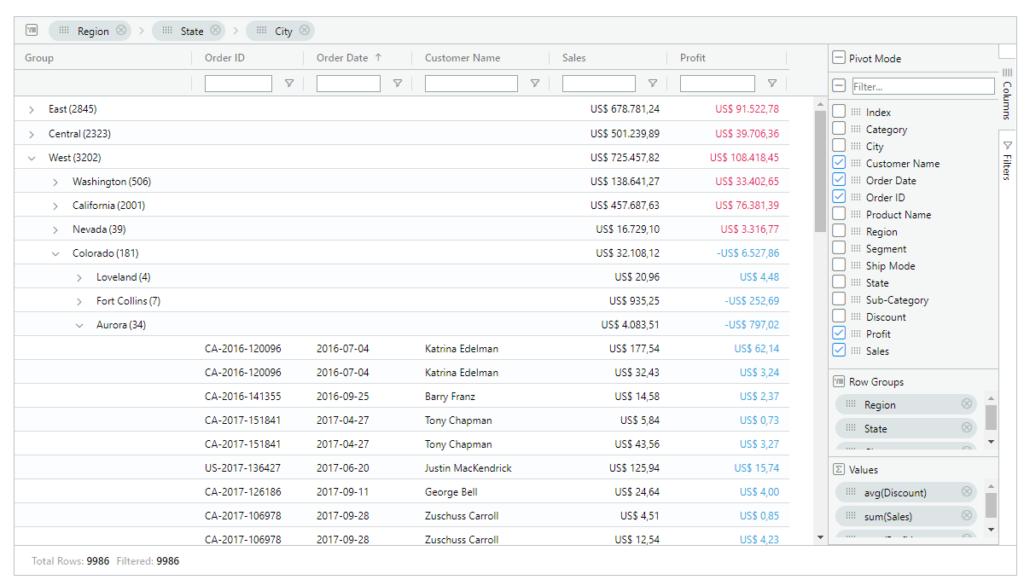
Tables are heavily used in Tableau Dashboards, often for providing context, analyzing hierarchies, or adding details to visualizations. Tableau’s default table features are robust but limited when it comes to grouping or filtering.
With the “SuperTables” extension, you can offer users dynamic and interactive tables that allow them to organize or analyze data in a flexible grid.
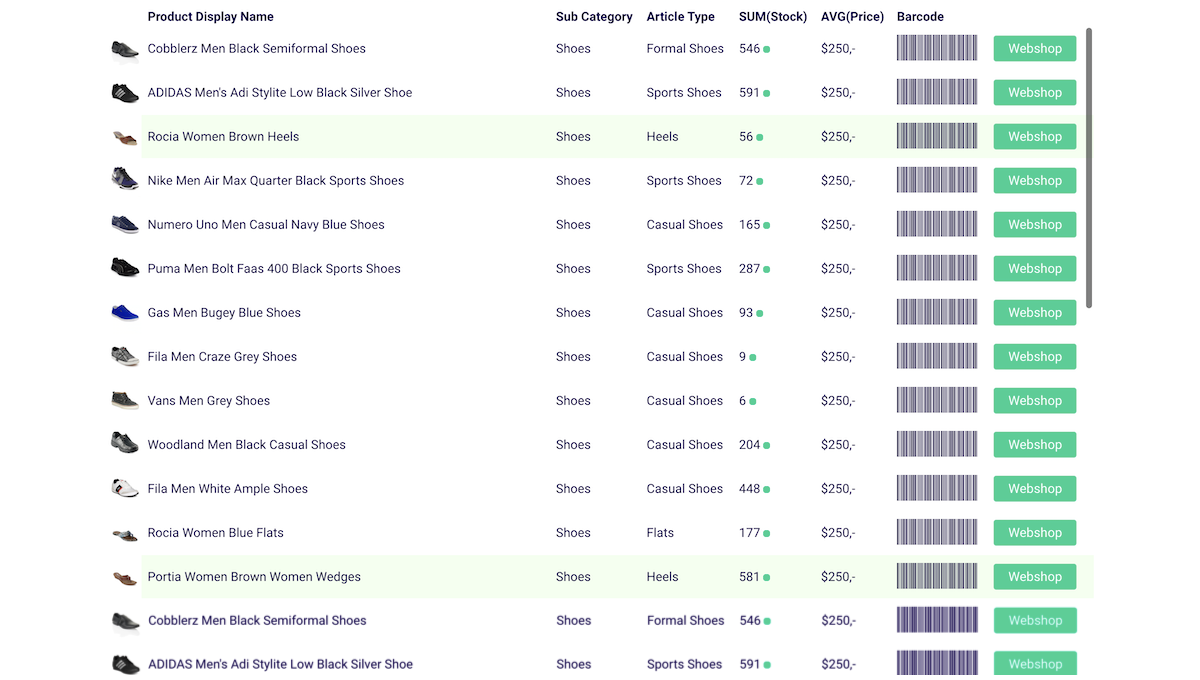
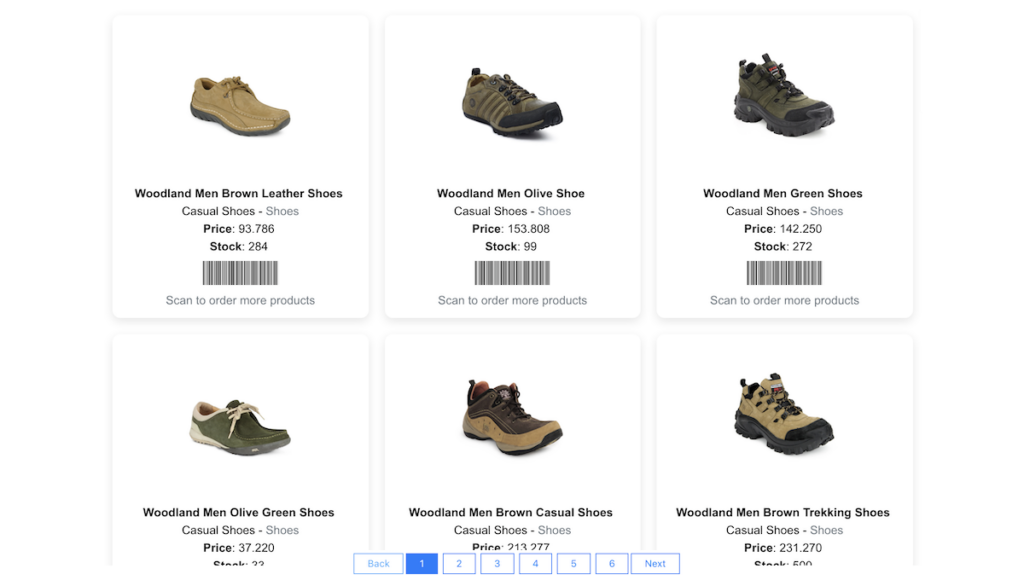
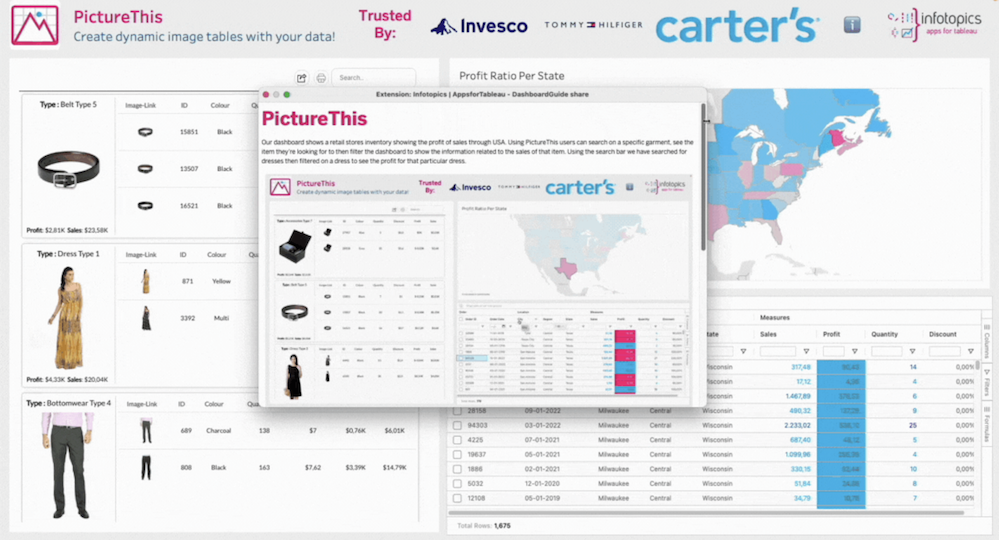
The “PictureThis” extension offers URLs, images, and background shapes, allowing you to create dynamic image tables that can be used as filters within the dashboard.
With this extension, images in dashboards can be sourced from specific datasets and automatically processed for an engaging and responsive outcome, suitable for any device. Images will act as filters for other worksheets within the dashboard.
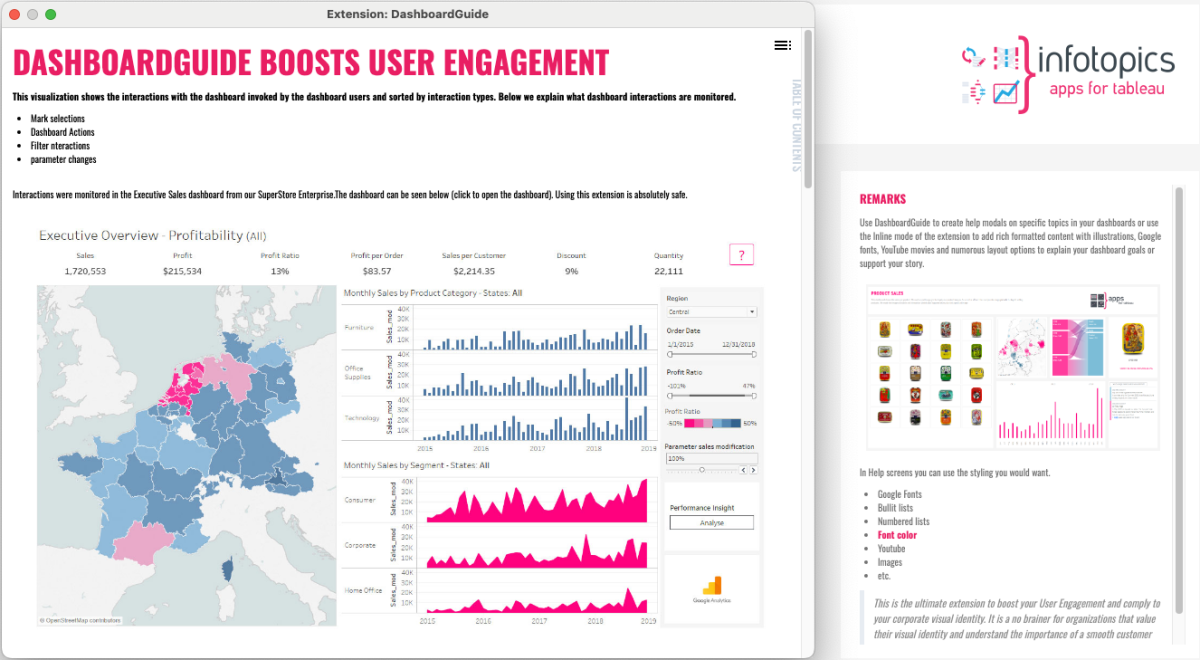
Tableau users are familiar with the power of data analysis and metadata used in visualizations, but what about the dashboards themselves? With “DashboardGuide,” the mystery is gone!
This extension helps you save time, improve presentation quality, and provide the basic information, purpose, or KPI definitions of your dashboard. You can explain how and why you developed your dashboard and how you enhanced the user experience.
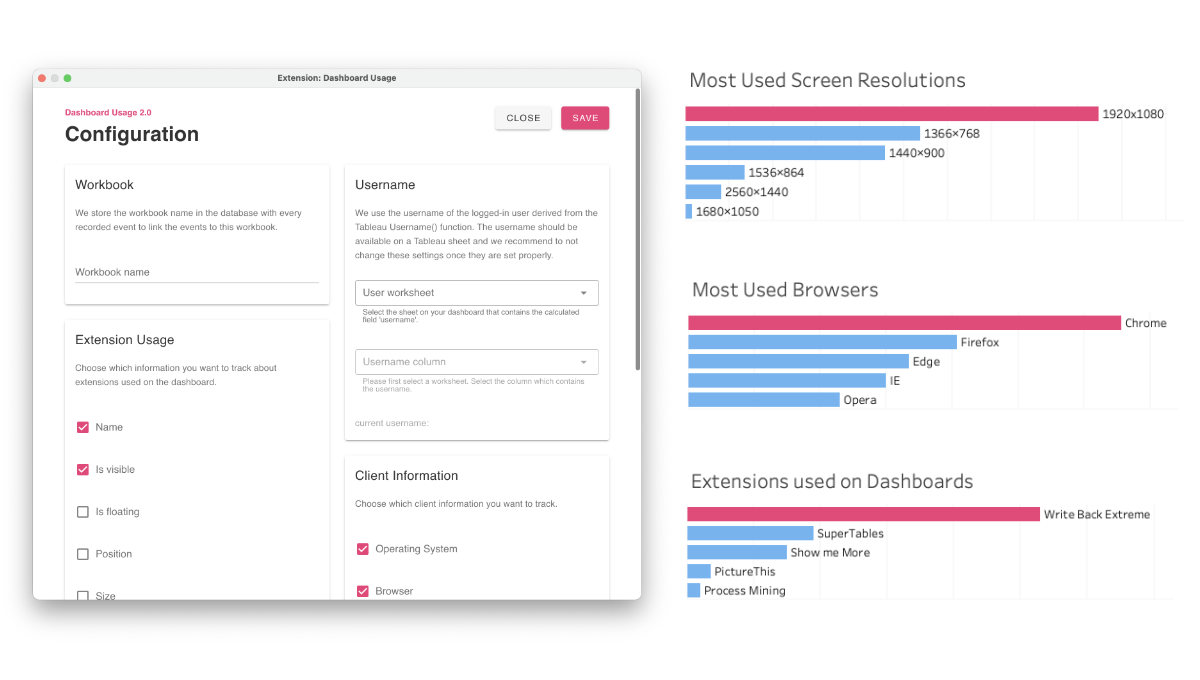
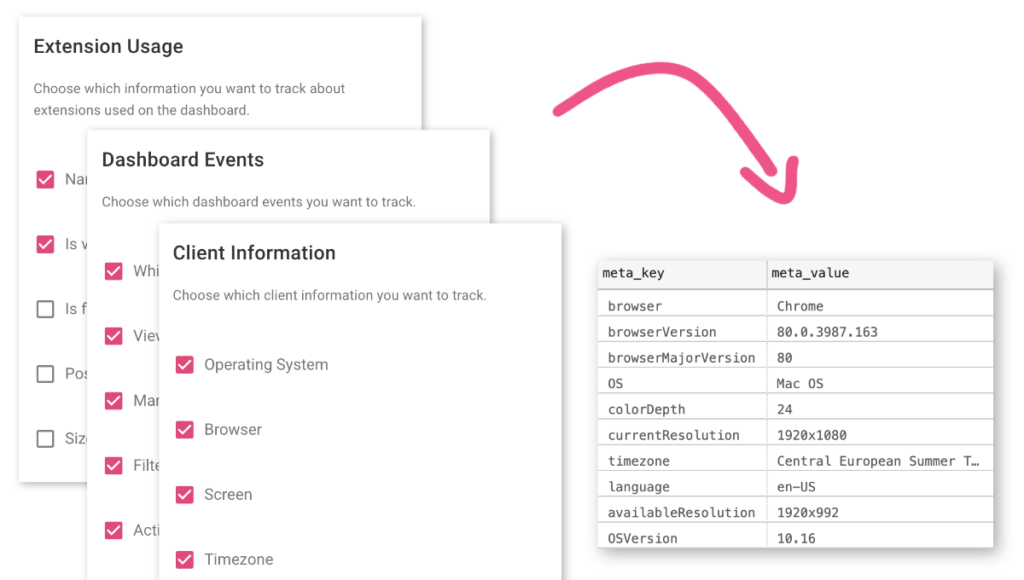
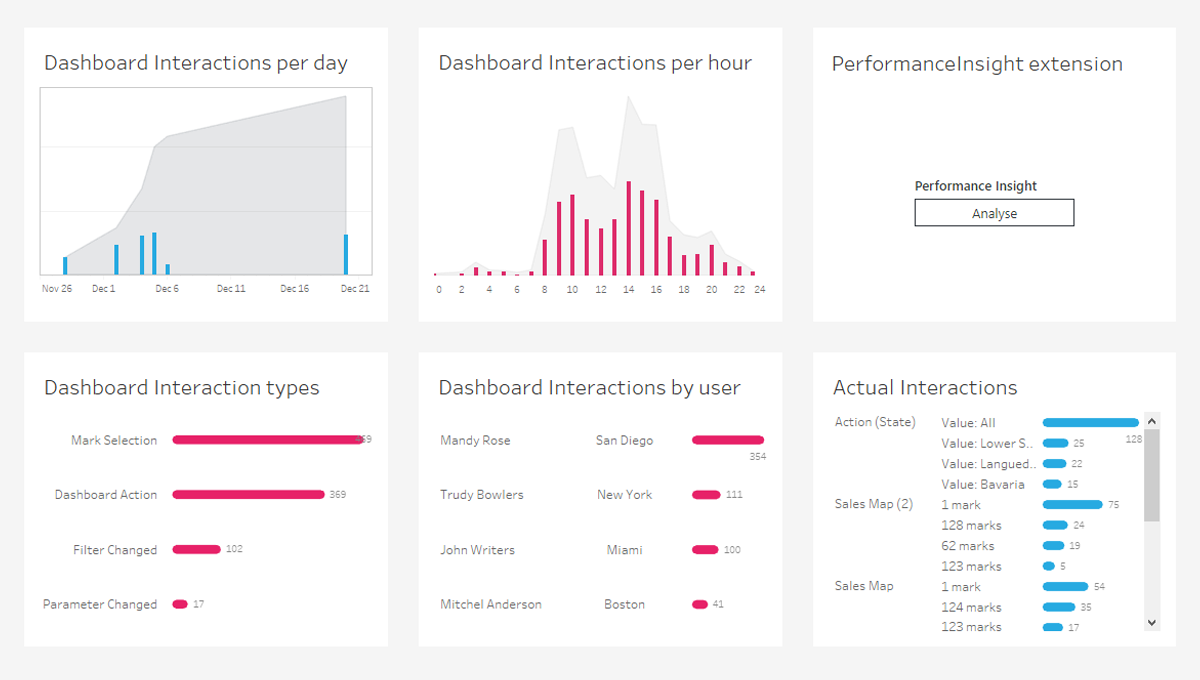
To get the most out of dashboards and understand how users interact with visualizations, “Dashboard Usage” is the perfect extension. By analyzing collected data, dashboards can become valuable strategic tools for future decisions.
“Dashboard Usage” is based on Google Analytics, the most reliable tool for tracking traffic, content viewed, clicked, and searched by users
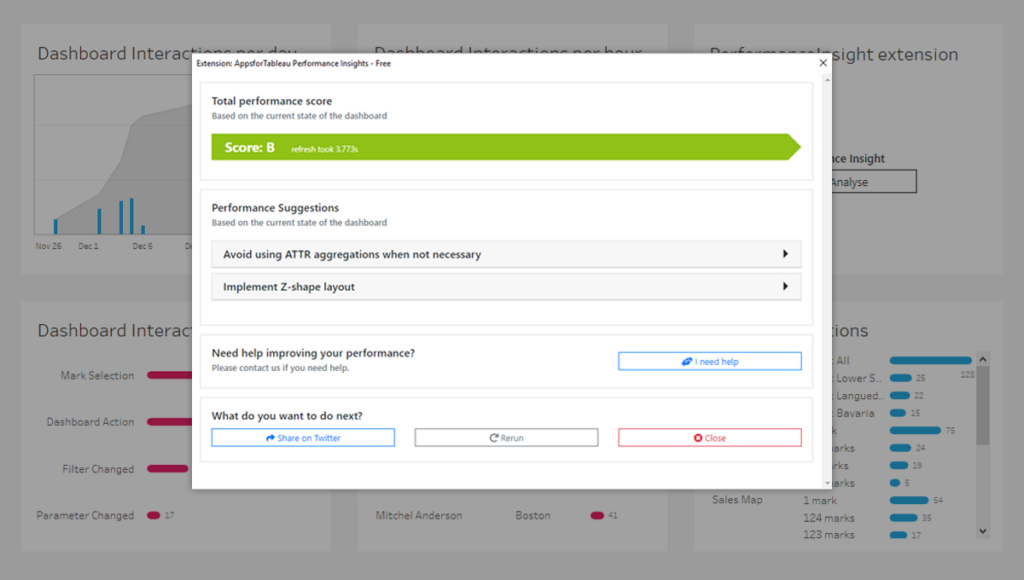
The highest customer satisfaction comes from delivering high-performing and visually appealing dashboards. The free “Performance Insight” extension for Tableau helps creators and developers gain insights and feedback on performance optimizations for their dashboards.
Do you want to find out which Business Intelligence solutions and services are best suited to your needs? We will help you understand! Fill out your request: our Team will contact you as soon as possible.