We shape your data by following UX and UI Design principles. Dashboard Design solutions focused on data, BI, and Data Visualization
UX/UI + Data Analysis: The Alchemy That Creates Value
The integration of Design and Data Analysis creates accessible, clear, and valuable dashboards
The success of a dashboard is not only about gathering and displaying data. Designing an effective dashboard requires careful planning, with a focus on the real needs of users. And this is where design comes into play.
Following UX and UI design principles in dashboards means designing intuitive pathways, effective functionalities, and a flexible experience capable of adapting to various needs. We create interfaces that optimize usability and enhance visual impact, providing intuitive and interactive access to insights.
Data-driven design solutions
Tailored services for successful dashboards, visualizations, and storytelling
Strategy e UX Design
We start by analyzing users—who they are and what they need—and defining the objectives of your dashboards to ensure targeted design decisions aligned with business requirements.
We create intuitive interfaces by applying UI design principles. Based on the analyzed requirements, we develop interactive prototypes, allowing you to test and visualize your dashboards before development.
Data Visualization
We help you choose the best approach and chart to represent your data clearly, quickly, and effectively, ensuring immediate comprehension.
Customization & Brand Guidelines
We tailor dashboards according to your brand guidelines, creating custom Design Systems and templates for a coherent and distinctive design.
Data Comic
We tell stories through data, combining visualizations and storytelling in a comic book style to make information engaging and easy to understand.
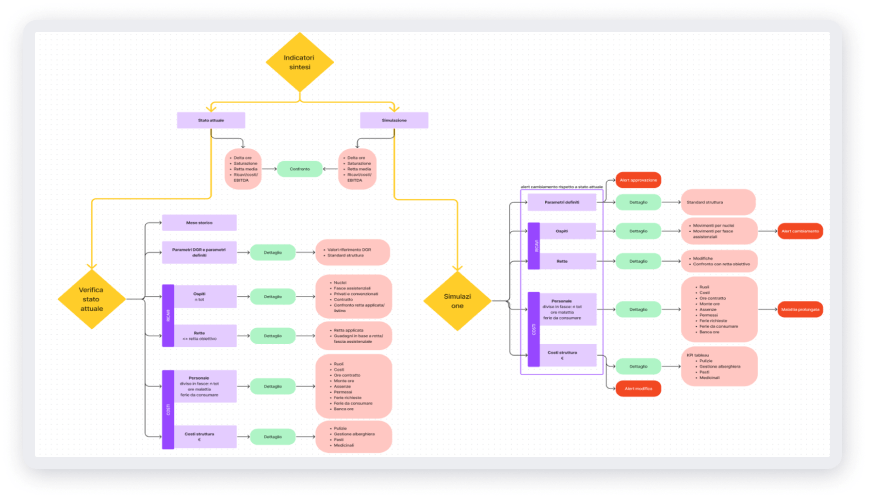
Dashboard Design: Our Approach to Design
We apply design principles and methods to engage the client throughout the entire design process
Analysis & Strategy
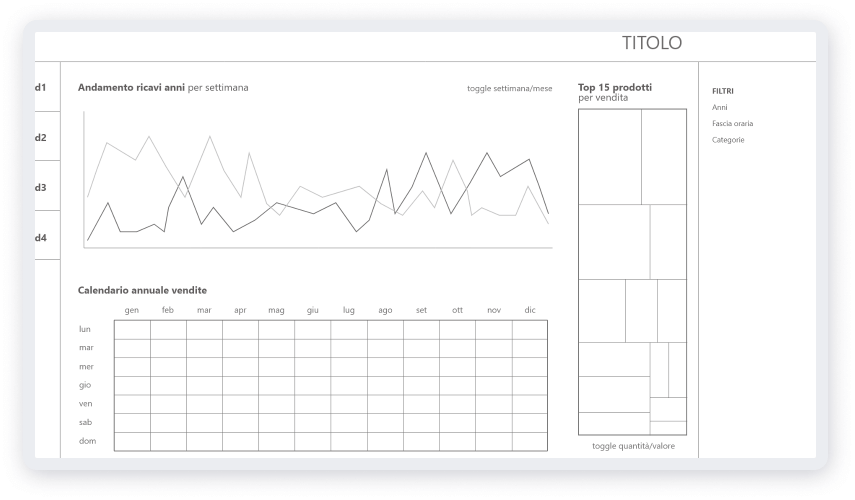
Low Fidelity
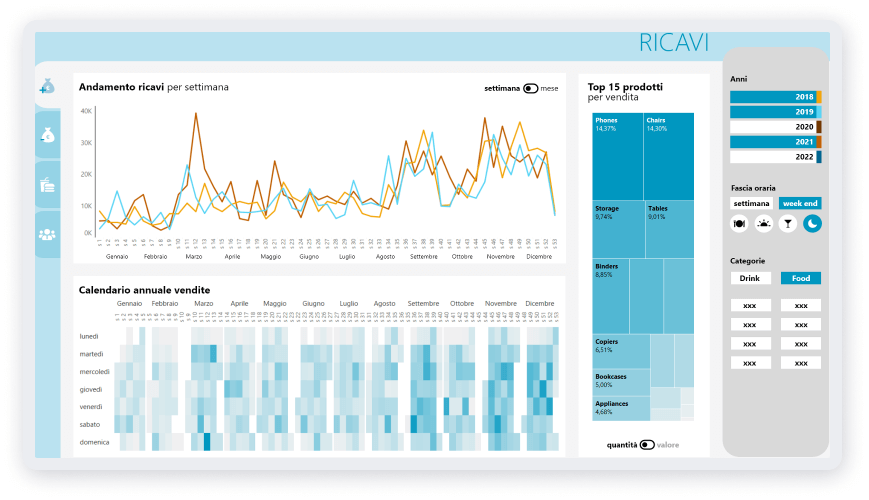
High Fidelity & UI
Optimization
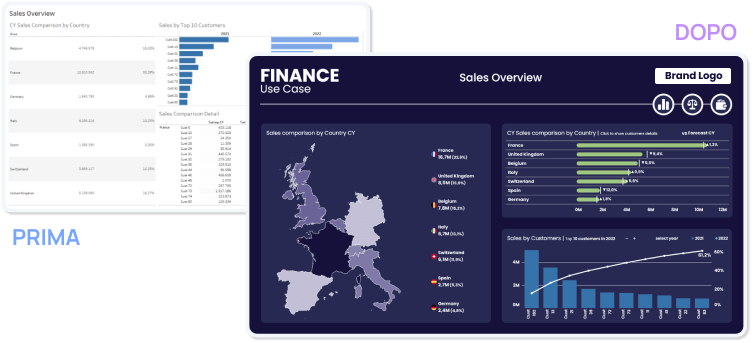
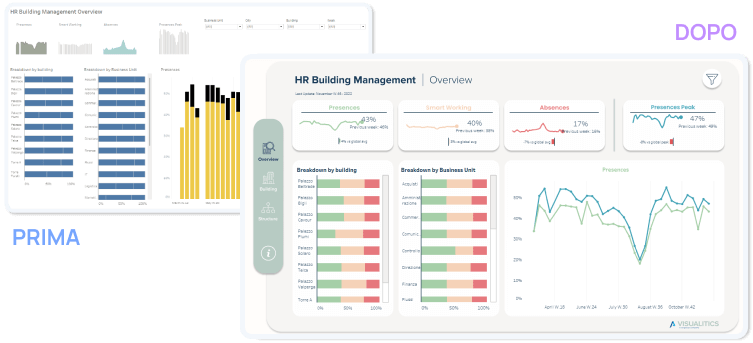
Clear. Intuitive. Effective Dashboards.
Tailored solutions to transform data into actionable insights, integrated with your design system.
We turn data into clear, personalized visual experiences, seamlessly aligned with your brand identity.
A dashboard becomes not just an analysis tool, but a distinctive product. It reflects your design system, making it unique and functional for understanding data and identifying insights, facilitating quick and informed decisions.
Dashboards as an Integrated Product
Custom Design System
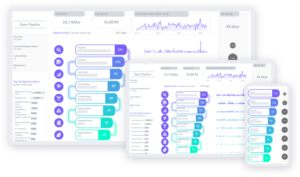
From static visualizations to interactive dashboards
Get in touch
Do you want to find out which Business Intelligence solutions and services are best suited to your needs? We will help you understand! Fill out your request: our Team will contact you as soon as possible.