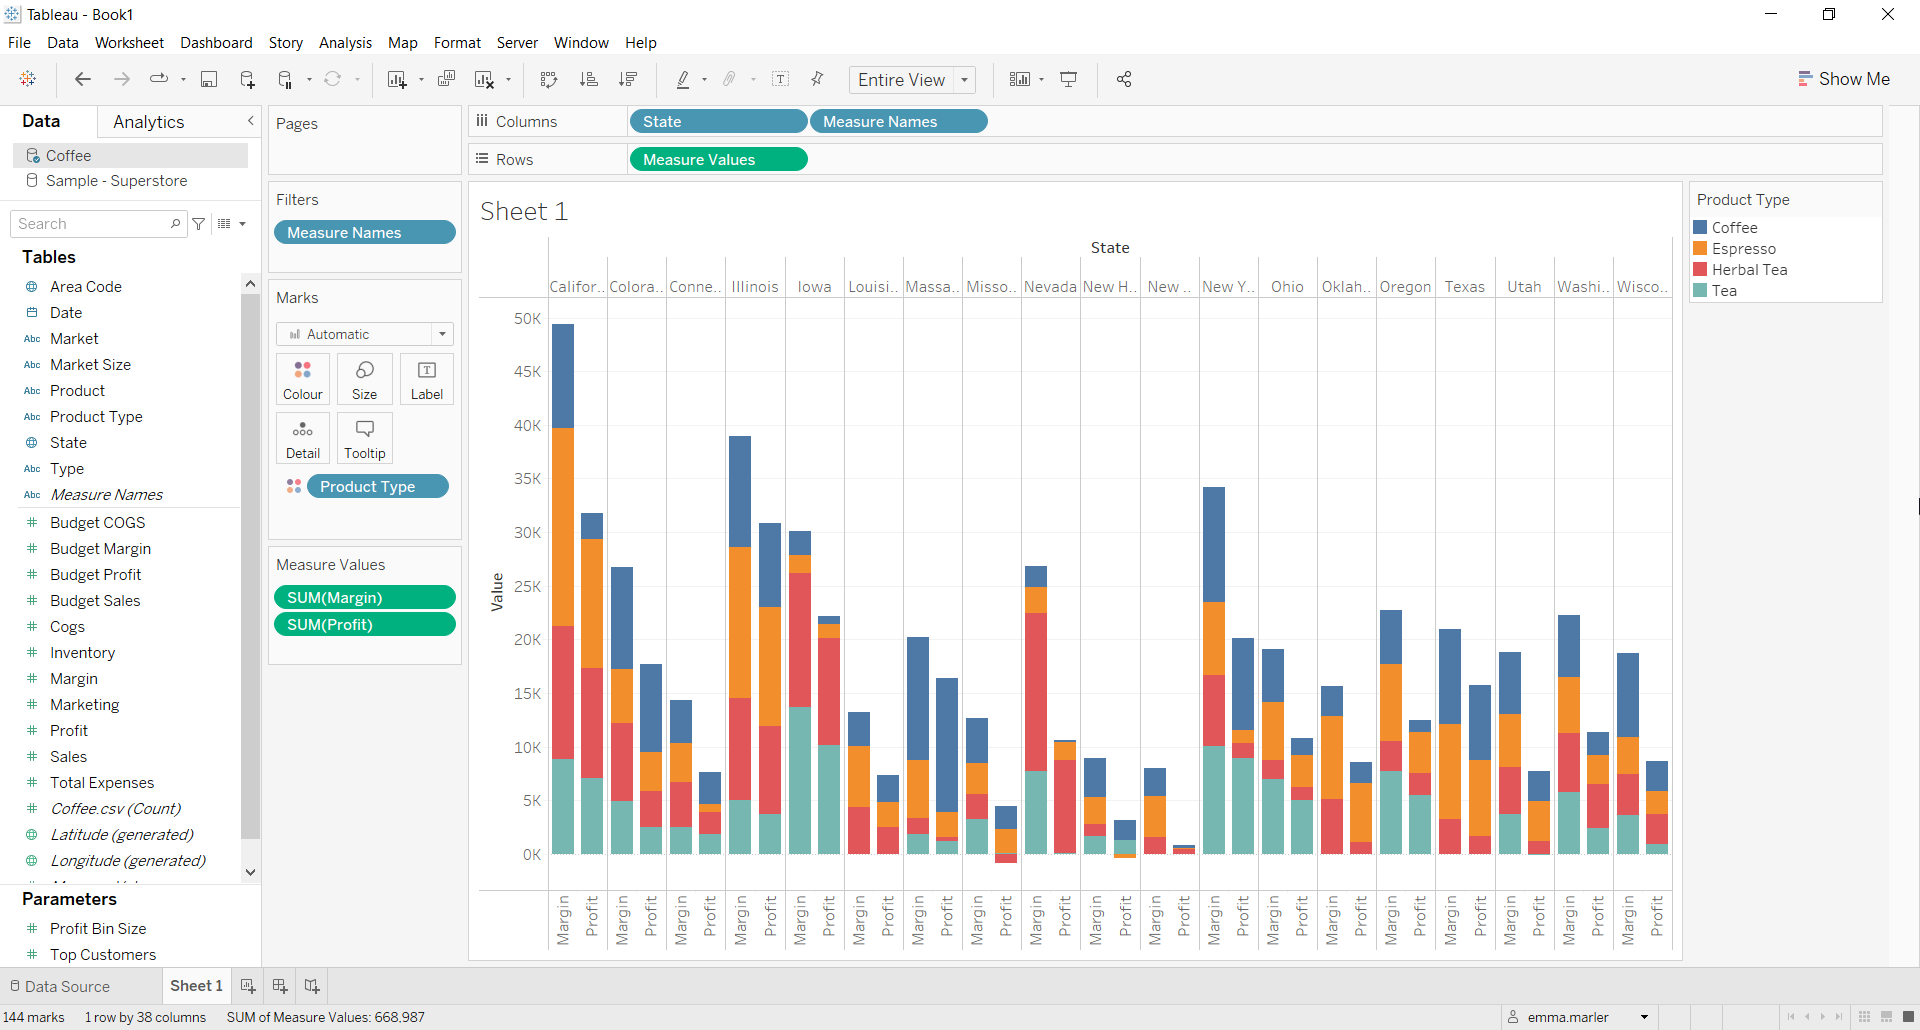
A stacked side-by-side bar chart is an extension of the stacked bar chart. Instead of having individual stacked bar charts, we can plot them all in one graph. It is useful when we want to quickly compare two or more different variables in one state, month, year, etc.
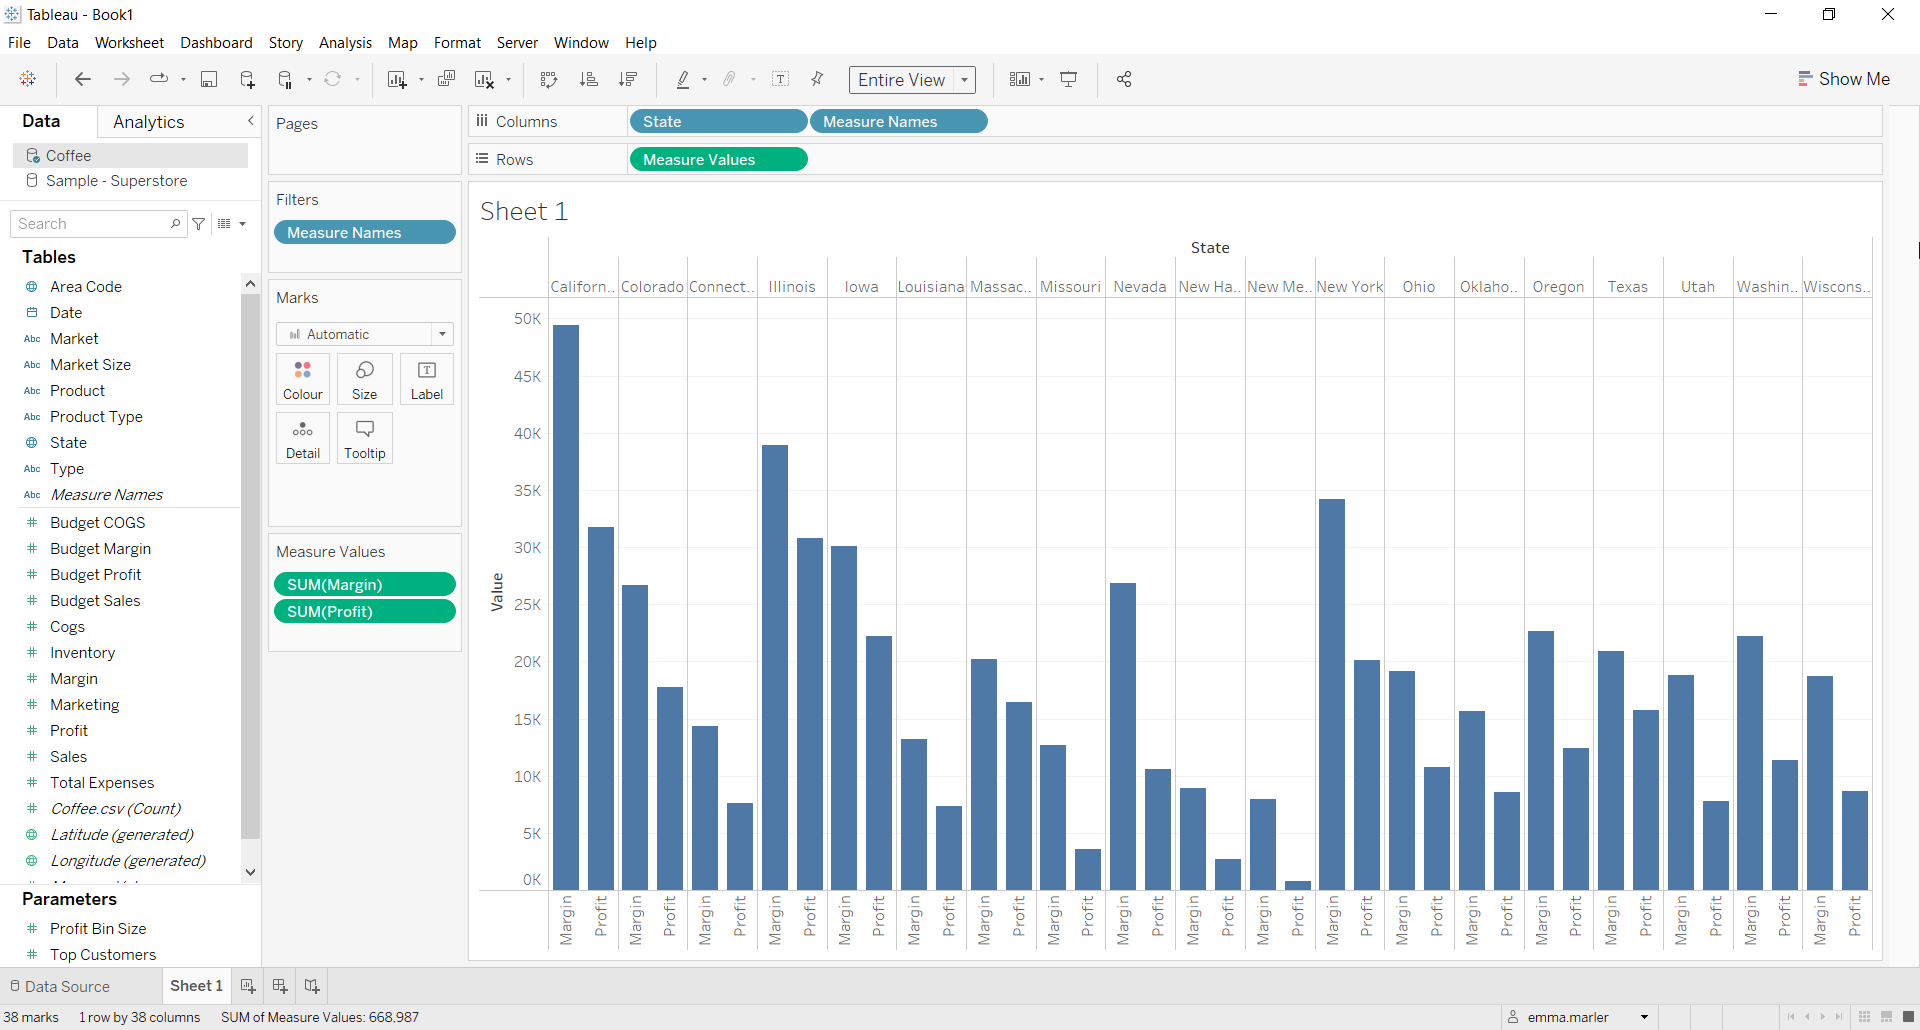
Let’s now see how to build step-by-step a stacked side-by-side bar chart on Tableau. Our goal is to create a chart showing margins and profits per state and per type of product.
Step 1. Create a bar chart
- Connect to the data source (in this case we are not using Sample Superstore).
- Drag State to the Columns.
- Drag Profit to Rows. Tableau will automatically create a standard bar chart.
Step 2. Create a stacked side-by-side bar chart
- Drag Margin on the y-axis which are labelled as Profit. Fit to Entire View from the toolbar to visualize it better.

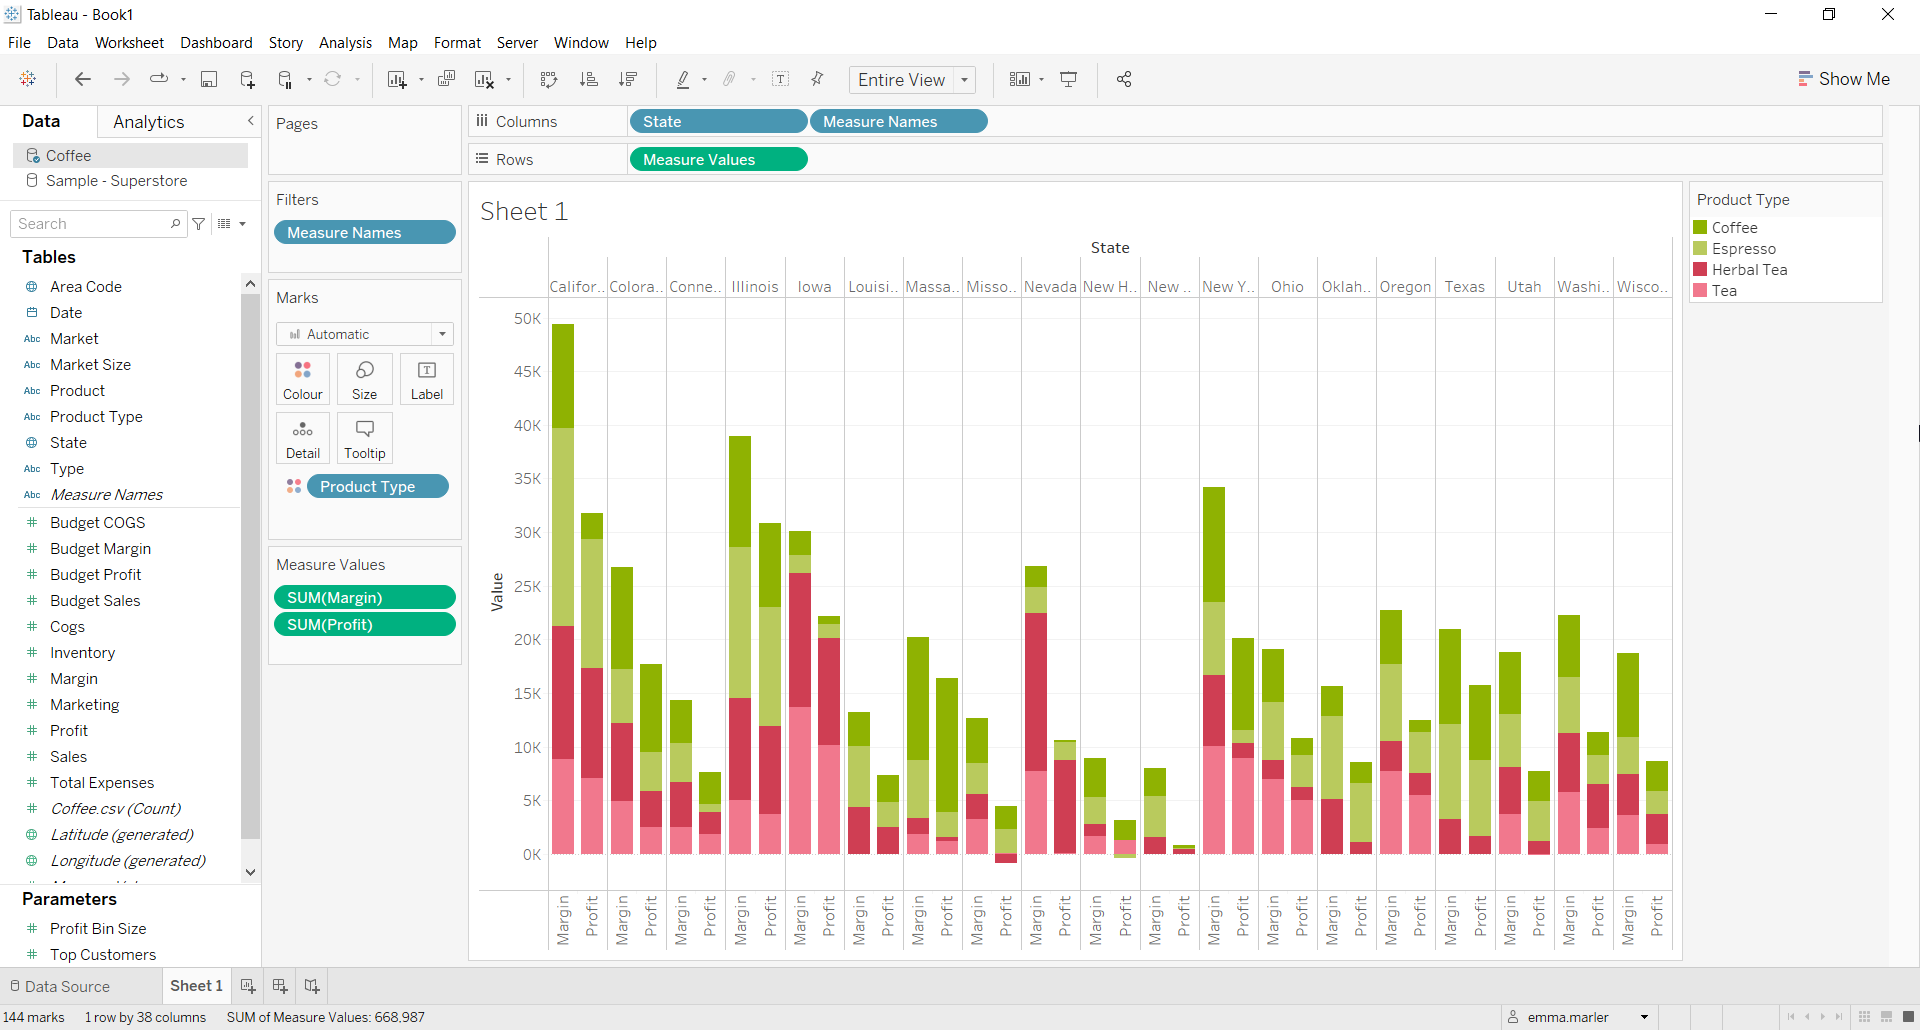
- Drag Product Type on Color in the Marks card. You’ll get a side by side stacked bar chart!

- Edit the colours if you want. We chose the Summer palette from the Marks card.

Don’t wait! Contact us to learn more and continue to follow upcoming news on our website and LinkedIn channel.