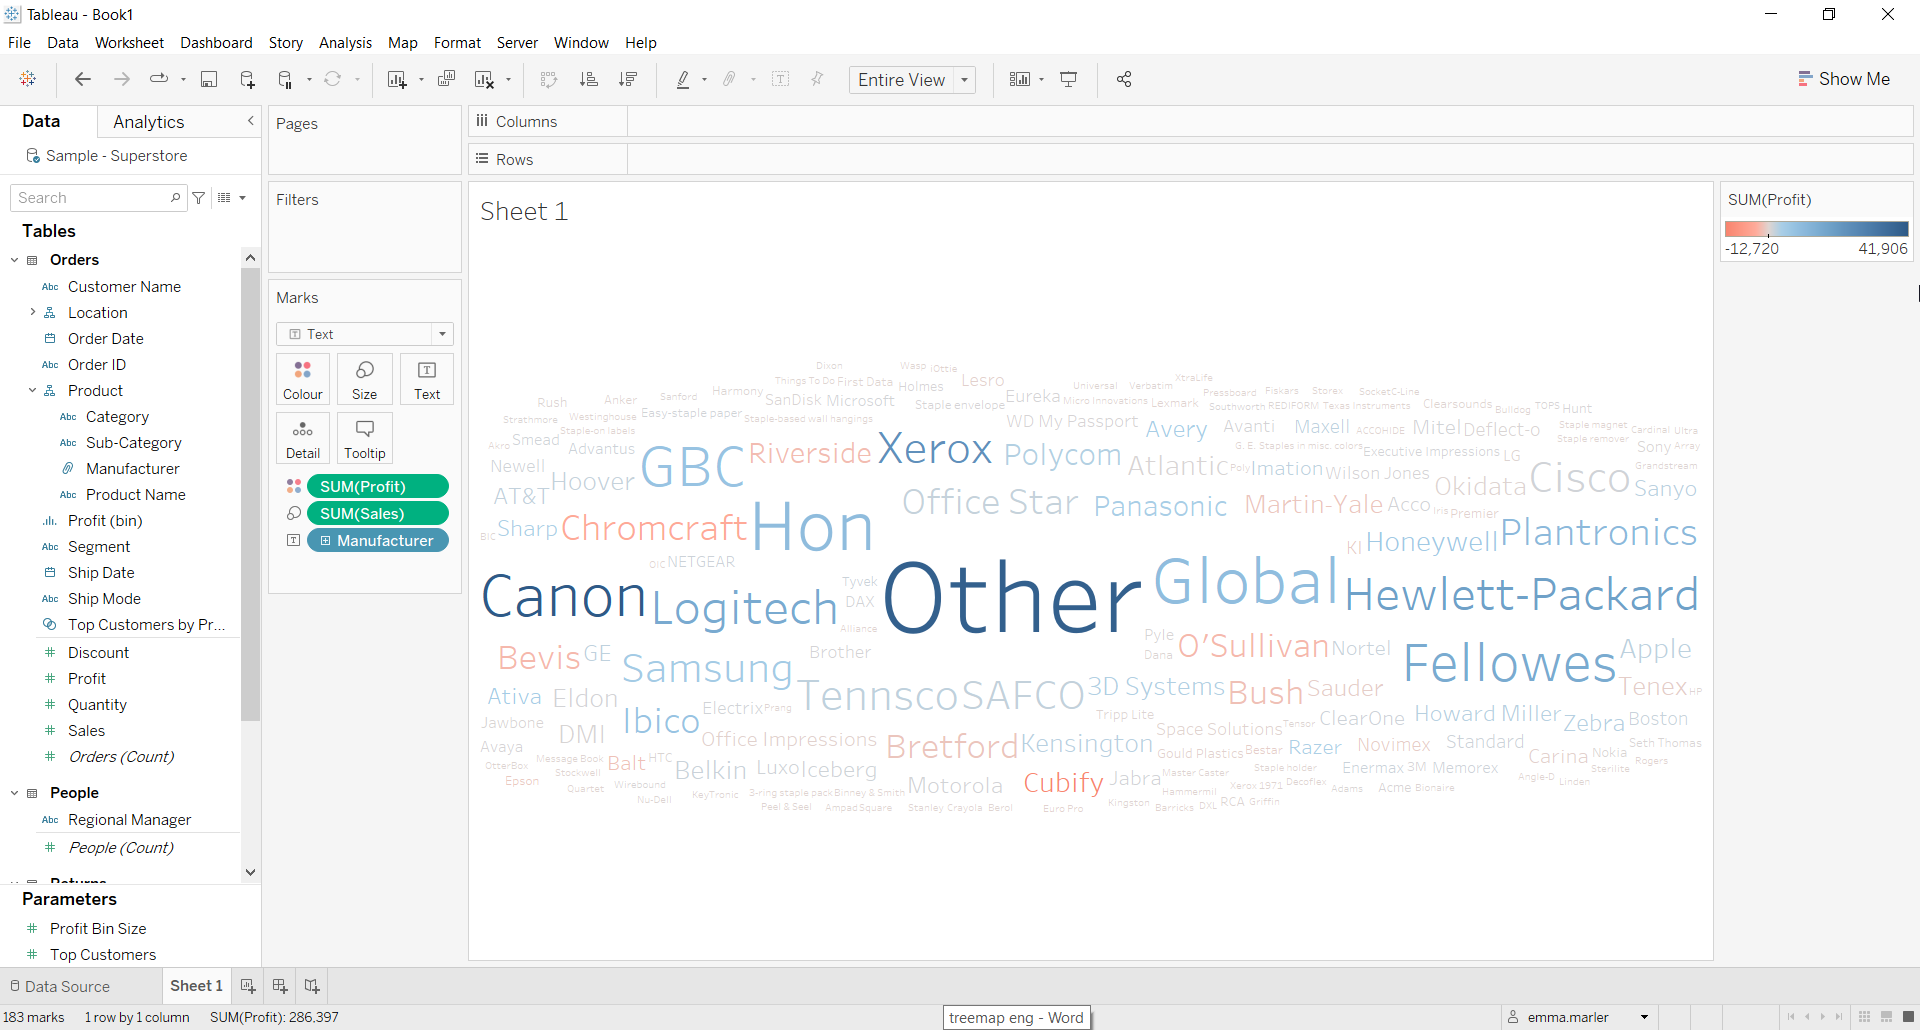
Wordclouds are a very engaging kind of data visualization. They show the frequency with which an item in a category of data appears by representing it with different sizes or sometimes colors as well.
Let us then see how to build step-by-step a wordcloud on Tableau. Our goal is to create a wordcloud showing sales and profit per manufacturer from the Sample Superstore data.
Step 1. Create a wordcloud
- Connect to the data source Sample – Superstore.
- Select Text from the dropdown menu in the Marks card.
- Drag Manufacturer on Text in the Marks card.
- Drag Sales on Size in the Marks card.

- Drag Profit on Color in the Marks card. You can edit the colour palette as you wish. Fit to Entire View and you’re done!

Don’t wait! Contact us to learn more and continue to follow upcoming news on our website and LinkedIn channel.