In this article, we’ll explain what a Sankey diagram is, its origins, and its evolution over time. We’ll also guide you through creating one using both the Infotopics Extension and the new feature in Tableau 2024.2. Sankey diagrams are not commonly used in business contexts but are ideal for analyzing flows between different dimensions.
What is a Sankey Diagram?
A Sankey diagram is a type of “flow diagram” that displays volumes or the intensity of value movements between two or more conditions using both size and color. The width of the arrows is proportional to the amount of each flow, with different colors distinguishing them.
The History of Sankey Diagrams
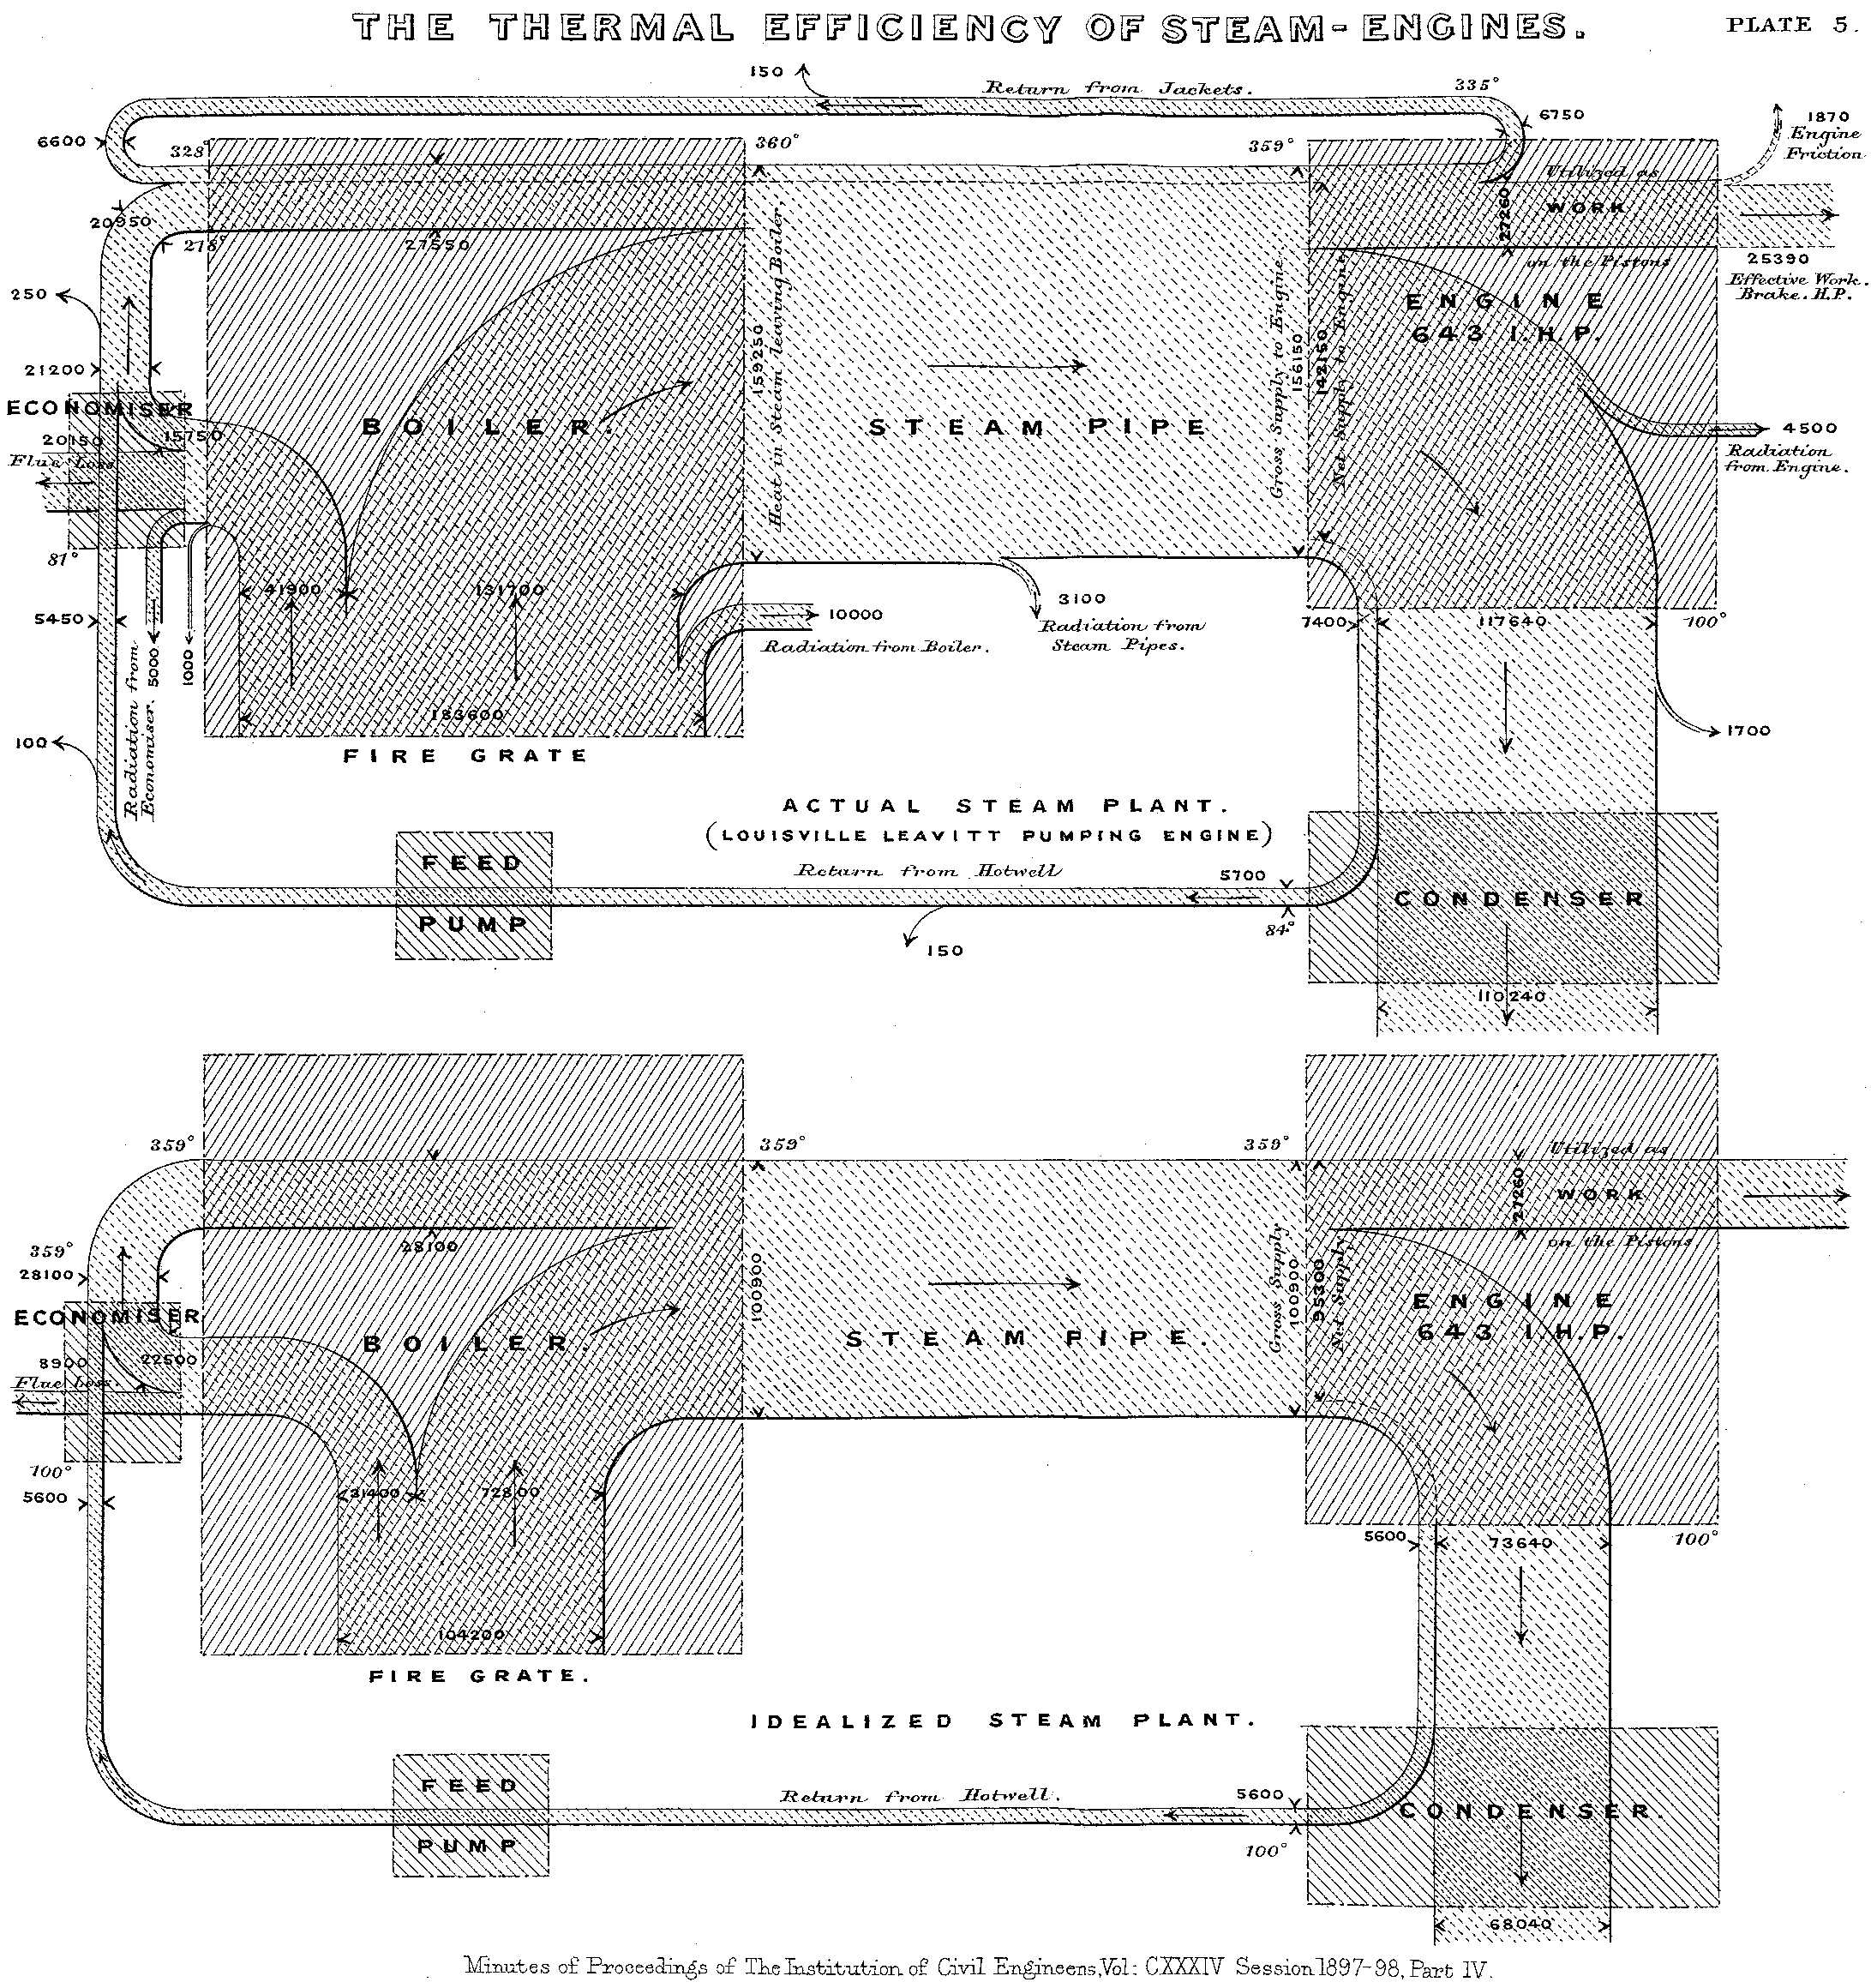
The Sankey diagram is named after Irish captain and engineer Matthew Henry Phineas Riall Sankey, who in 1898, while seeking to represent steam engine efficiency, used this type of visualization to graphically illustrate heat loss. Sankey’s original diagram used only one color, sufficient for the singular flow he aimed to represent.
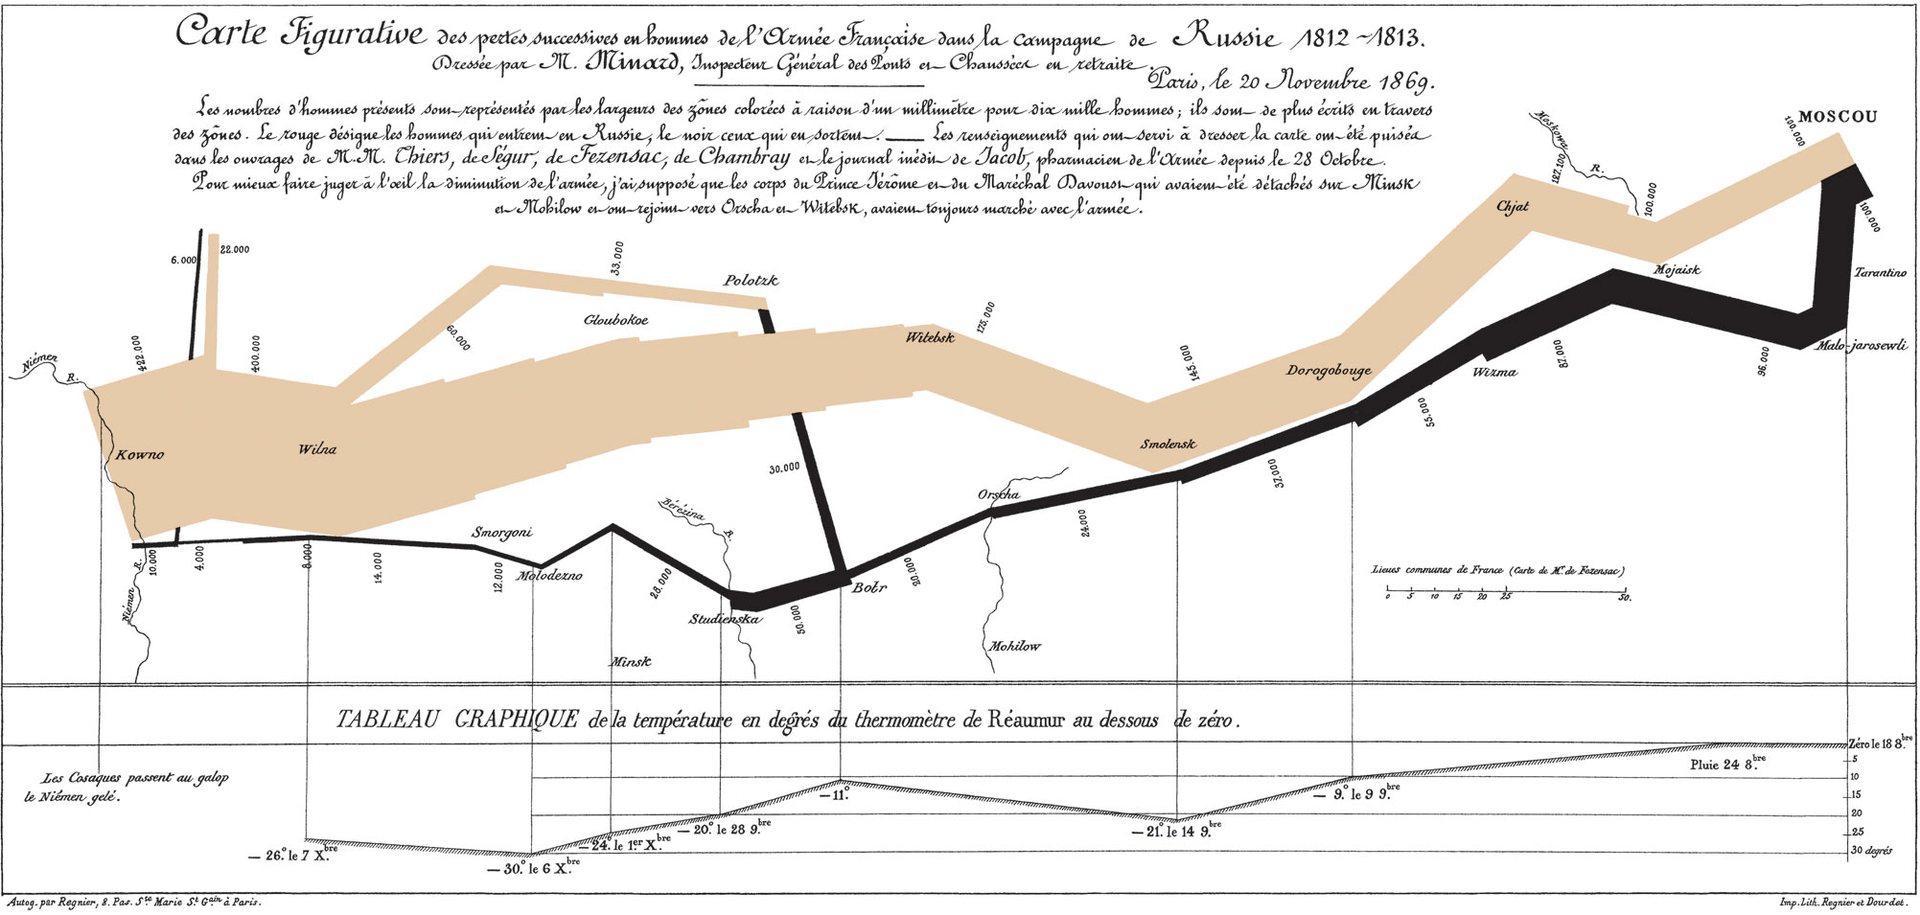
Minard’s Flow Map Preceding Captain Sankey, Charles Minard created a flow map in 1812 depicting Napoleon Bonaparte’s disastrous Russian campaign. Minard’s map managed to represent six distinct types of information: the number of troops, distance, temperature, latitude and longitude, direction, and dates.
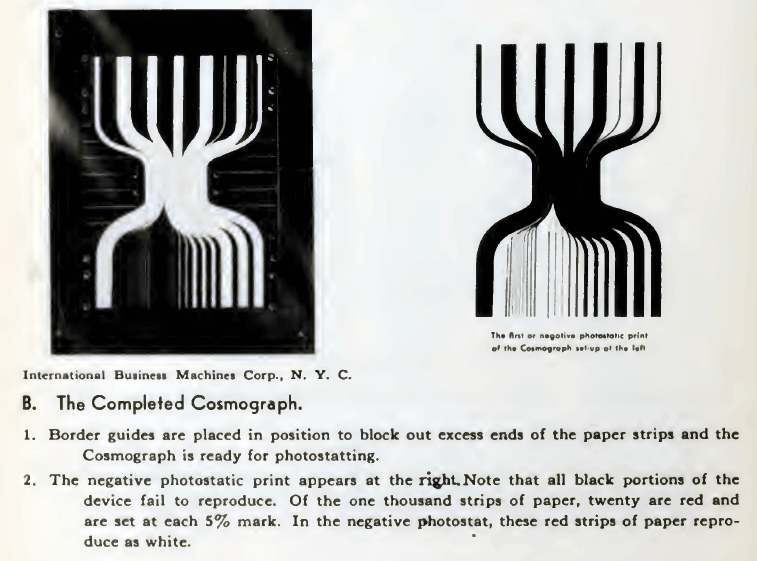
Over the years, the Sankey diagram has also evolved in physical formats. For instance:
IBM’s Cosmograph (1933): Built using 1,000 sheets of paper.
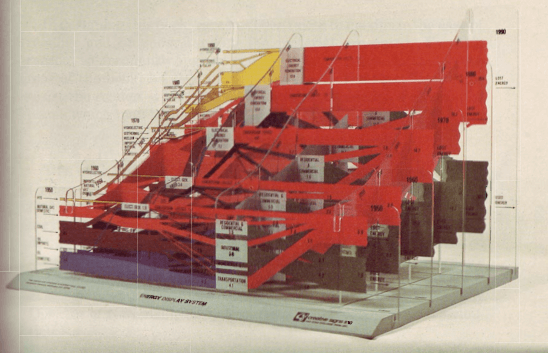
In 1970, a 3D Sankey Diagram was created by the Center for Strategic & International Studies (CSIS) to represent complex energy flows. It likely required five layers of sheets for its construction.
Creating a Sankey Diagram in Tableau
With the advancement of time and the arrival of computers, creating a Sankey Diagram has become increasingly simple and fast. Let’s look at how it first emerged on Tableau.
A Sankey Diagram can be manually built in Tableau. However, this requires considerable time due to the need to construct numerous calculated fields, making it far from the quickest approach for creating this type of diagram.
To avoid the lengthy process of manually building a Sankey Diagram, Tableau Extensions offer a solution. Tableau Extensions are web applications in the form of .trex files that provide exclusive functionalities to meet a wide range of needs.
How to Build a Sankey Diagram Using the Show Me More 2.0 Extension
Here’s how to use the Infotopics Extension to create a Sankey diagram. First, connect to Tableau’s “Sample – Superstore” data source. For example, let’s build a Sankey Diagram using Category and Ship Mode as dimensions and Sales as the measure.
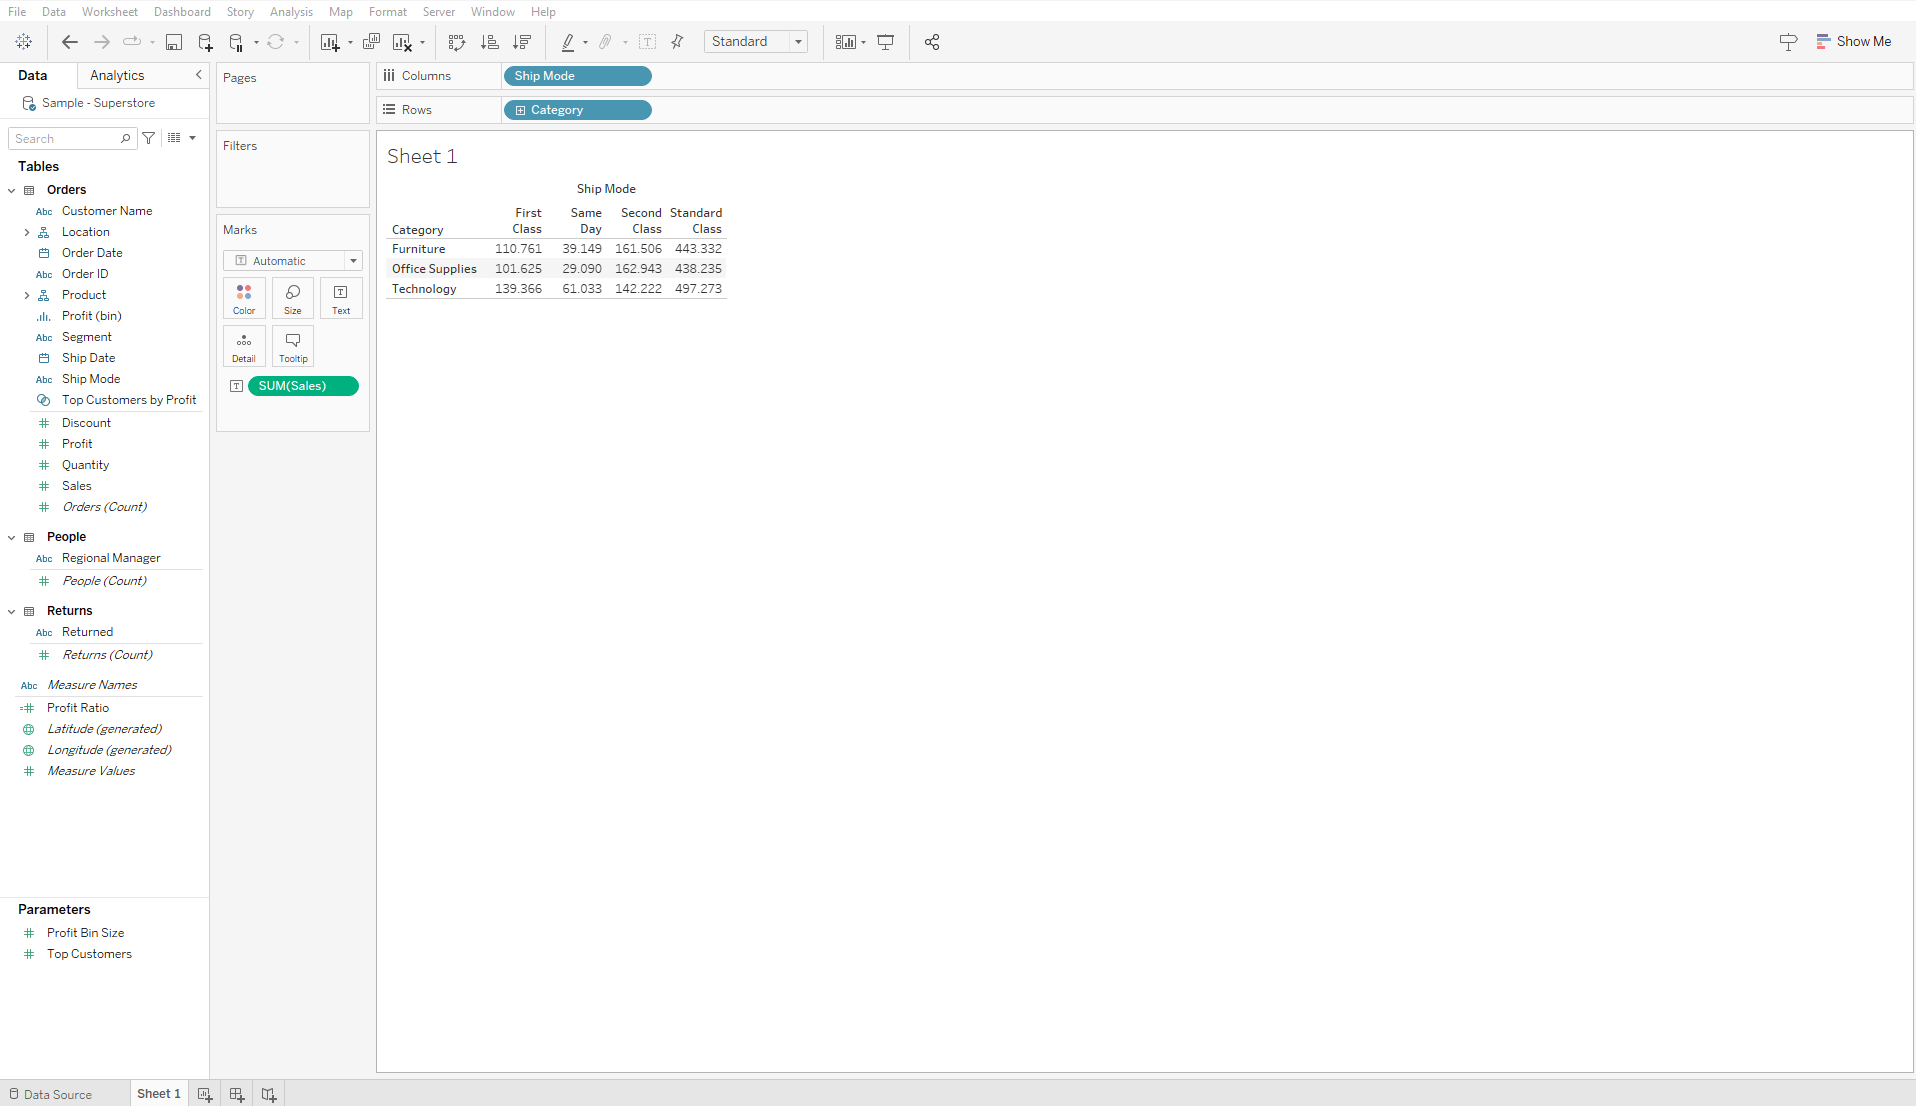
Start by creating a sheet with the selected dimensions and measures. Build a table by dragging Category to Rows, Ship Mode to Columns, and Sales to Text.
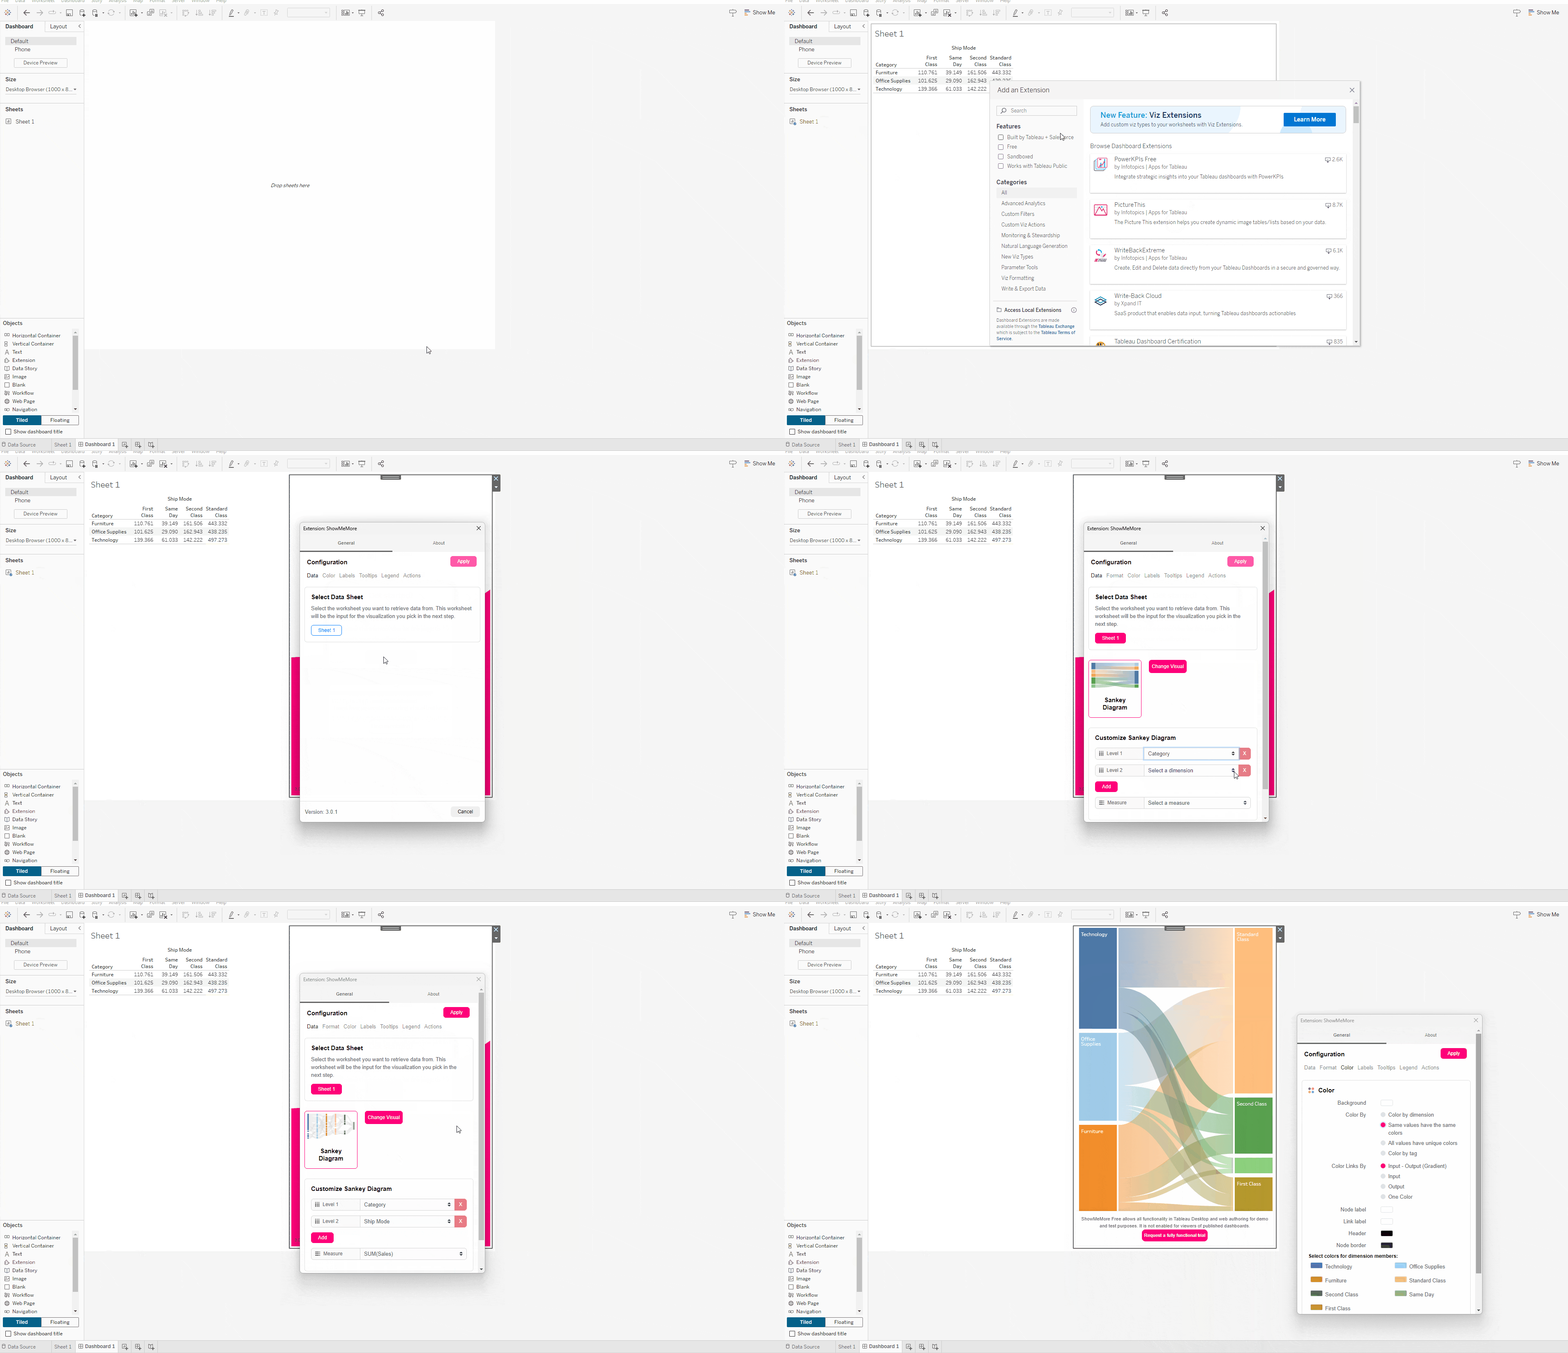
- Next, create a dashboard and add the sheet you just created.
- Drag the “Extension” object into the dashboard, and from the pop-up window, search for the “Show Me More 2.0” Extension.
- Click Start configuring and fill in the required and optional fields to create your preferred Sankey diagram.
And that’s it! You’ve now created a Sankey diagram, which you can customize as you like from the Extension’s menu.
How to Create a Sankey Diagram with Tableau 2024.2
Nella nuova versione di Tableau 2024.2 rilasciata a luglio, costruire un Diagramma di Sankey sarà ancora più veloce! Faremo uso di un’Extension da inserire direttamente nel foglio di lavoro.
Per prima cosa ci colleghiamo all’origine dati di Tableau “Sample – Superstore”. Decidiamo, ad esempio, di rappresentare un Diagramma di Sankey utilizzando Category e Ship Mode come dimensioni e Sales come misura.
- Nella pagina iniziale di Tableau Desktop seleziona il menù a tendina all’interno della Marks Card e poi clicca sulla voce “Add Extension” al fondo dell’elenco.
- Nella finestra che compare, seleziona l’Extension che ti interessa, nel tuo caso la “Sankey by Tableau”.
- Puoi notare che ora nel menù a tendina della Marks Card, sarà comparsa l’opzione Sankey. Selezionala.
- Dal Data Pane, trascina una per volta le pills delle dimensioni nella sezione Level.
- Analogamente, trascina dal Data Pane anche la misura aggregata per Somma nella sezione Link.
Ecco fatto! In pochi semplici passi hai creato un Diagramma di Sankey.
Se vuoi visualizzare più dimensioni, puoi ripetere il punto 4.
With the new Tableau 2024.2 version released in July, creating a Sankey Diagram is faster than ever! We’ll use an Extension that can be added directly to the worksheet.
First, connect to Tableau’s “Sample – Superstore” data source. For example, let’s represent a Sankey Diagram using Category and Ship Mode as dimensions and Sales as the measure.
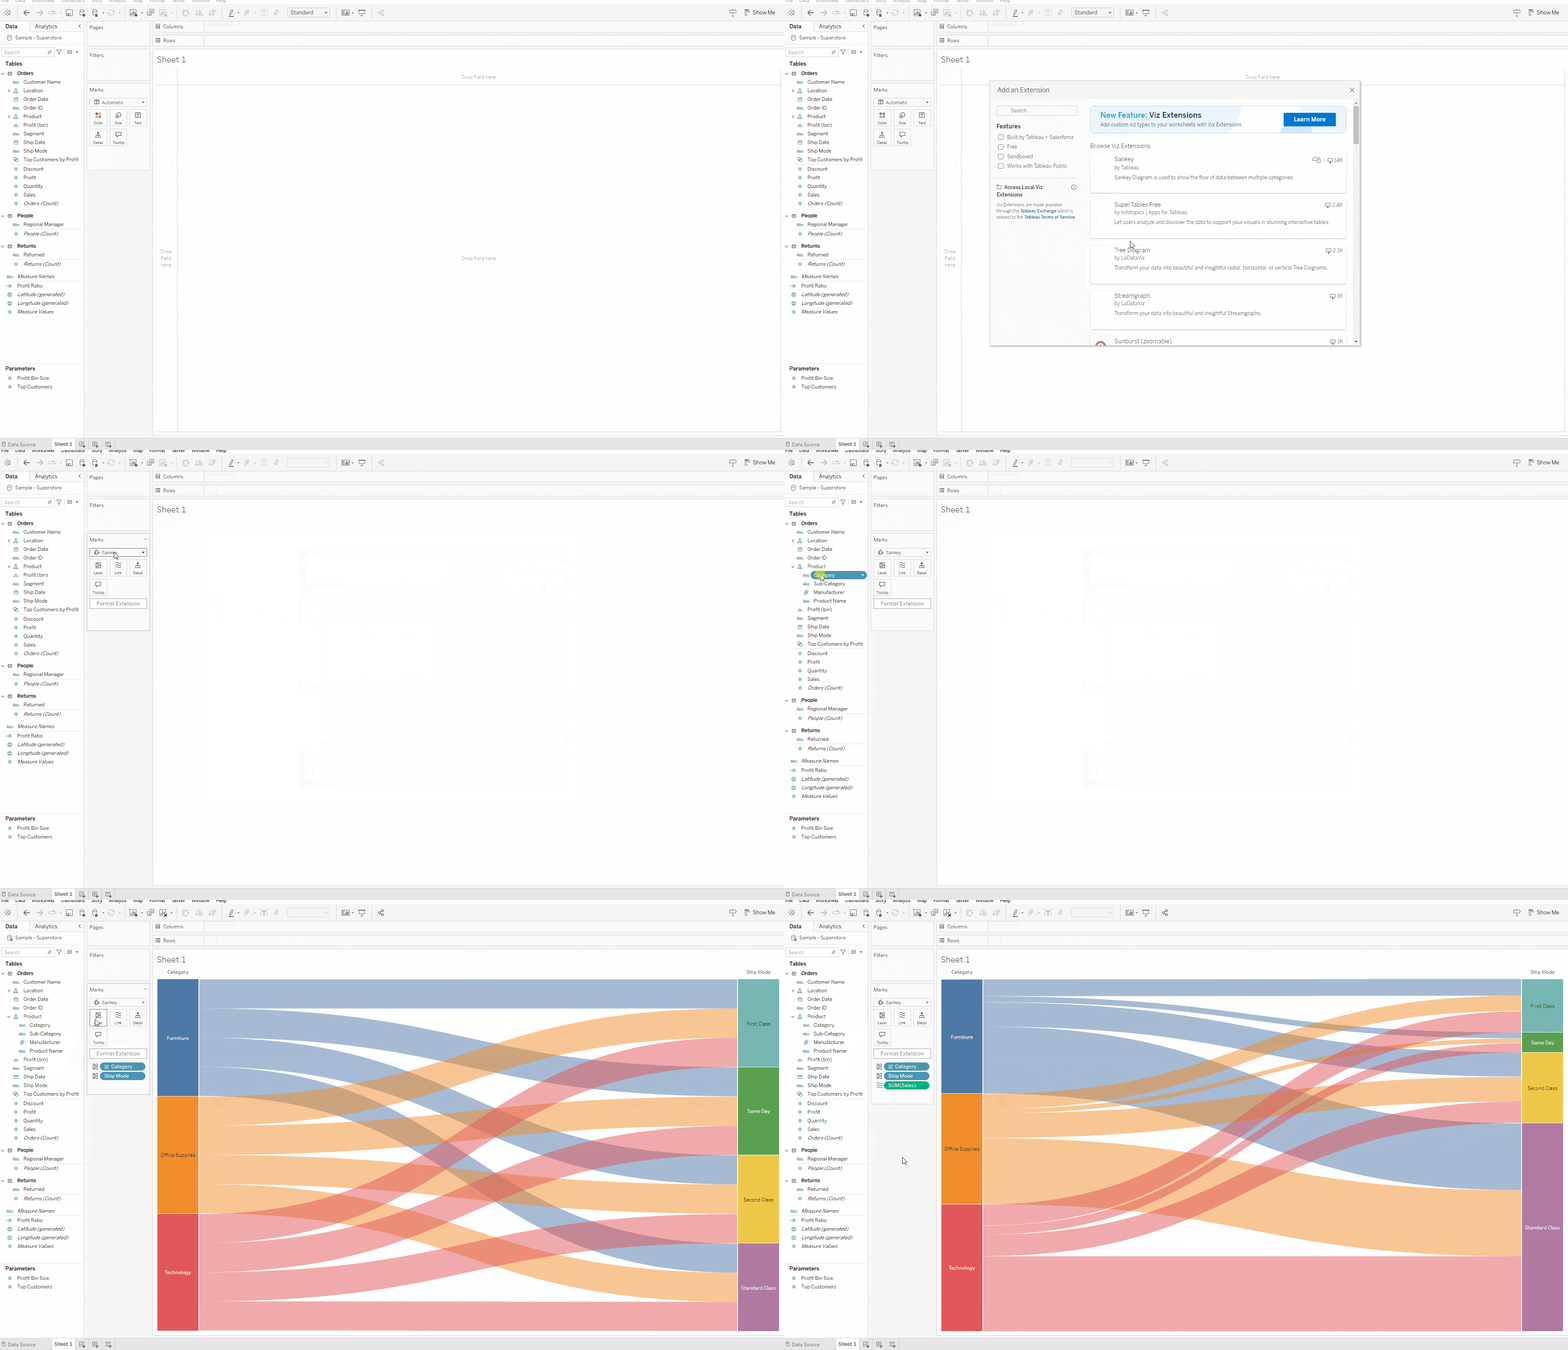
- On the Tableau Desktop homepage, open the dropdown menu within the Marks Card and select “Add Extension” at the bottom of the list.
- In the pop-up window, choose the desired Extension—in this case, “Sankey by Tableau.”
- You’ll now see a Sankey option in the Marks Card dropdown. Select it.
- From the Data Pane, drag each dimension pill into the Level section one at a time.
- Similarly, drag the aggregated measure (Sum) into the Link section.
That’s it! You’ve created a Sankey Diagram in just a few easy steps.
To display more dimensions, repeat step 5 for each additional dimension.
Conclusion
The Sankey Diagram belongs to a category of charts that display volumes or the intensity of value movements between two or more conditions. You can use the Sankey Diagram to analyze flows in time-based models or hierarchical structures.
As we’ve seen, creating such a complex diagram has become increasingly easy and fast. Today, thanks to Extensions and the latest Tableau 2024.2 update, it takes just a couple of minutes!
Read all our articles on Tableau
Do you want to discover the latest features or delve into certain functions to become an expert?
Visualitics Team
This article was written and edited by one of our consultants.
Sources:
1933 – IBM’s Cosmograph – dataphys.org
1970 – 3D Sankey Diagram – dataphys.org
Diagramma di Sankey – it.wikipedia.org
Sankey Diagram – think.design
Tableau Charts – tableautim.com
Tableau Extension – www.visualitics.it
Utilizzare le estensioni di dashboard – help.tableau.com
Share now on your social channels or via email: