In the world of Business Intelligence, DAX (Data Analysis Expressions) stands as a cornerstone. Developed by Microsoft, this formula language is a key component for data analysis and manipulation within Power BI, Power Pivot, and SQL Server Analysis Services (SSAS). But what exactly is DAX, why is it so significant, and how can it enhance data analysis? This article explores the nature of DAX, its core applications, and provides an overview of its main functions and capabilities.
What is DAX?
DAX, short for Data Analysis Expressions, is a formula language designed for advanced calculations on data in tabular models, such as those created in Analysis Services. DAX extends Excel’s capabilities, allowing users to perform complex calculations, create custom measures, columns, and tables, and model data relationships to enable deeper insights. Its syntax combines elements of Excel with relational algebra, offering a rich and intuitive language for data manipulation.
Why is DAX Important in Power BI?
DAX’s significance lies in its ability to transform raw data into meaningful insights. In a business context, the ability to efficiently manipulate and analyze data can be the difference between making decisions based on hunches or informed insights. With DAX, Power BI users can perform complex analyses directly within the tool, avoiding the need for database manipulation with more complex languages like SQL. This accessibility simplifies decision-making by providing important insights for managing and controlling business performance.
Overview of DAX Functions in Power BI
DAX functions can be divided into several categories, each containing functions to handle specific types of calculations and data manipulations within Power BI. Key categories include:
1. Aggregation Functions
These functions are used to calculate aggregate values like sums, averages, counts, minimums, and maximums. They are essential for summarizing large datasets into key figures that are easily interpretable.
- SUM: calculates the sum of a column.
- AVERAGE: computes the average of a column.
- COUNT: counts the number of values in a column.
- MIN/MAX: finds the minimum or maximum value in a column.
2. Filtering Functions
Filtering functions modify the context of a calculation by applying specific filters to data. This is particularly useful for calculating values based on data subsets.
- CALCULATE: Modifies the filter context for a calculation.
- FILTER: Returns a table filtered according to specific criteria.
- ALL: Removes filters from a specific column or table.
3. Time Intelligence Functions
Designed for working with dates and time periods, these functions are essential for analyses like year-over-year comparisons, cumulative sales, or historical trends.
- SAMEPERIODLASTYEAR: Returns the same period for the previous year.
- DATESYTD: Returns dates from the beginning of the specified year up to a specific date.
- PREVIOUSMONTH: Returns all dates from the previous month.
4. Logical Functions
Logical functions enable logical tests and decision-making based on results. These functions are crucial for building conditional expressions.
- IF: Performs a logical test and returns one value if true, another if false.
- SWITCH: Evaluates an expression against a list of possible results and returns the corresponding value.
- AND/OR: Combines multiple logical conditions.
5. Mathematical and Trigonometric Functions
These functions offer standard mathematical operations like addition, subtraction, multiplication, and division, along with more complex functions like square roots and logarithms.
- ABS: Returns the absolute value of a number.
- ROUND: Rounds a number to a specified number of digits.
- EXP: Returns n raised to the specified power.
6. Text Functions
Text functions allow manipulation of text strings within data, making them especially useful for data cleaning and formatting.
- CONCATENATE: Joins two text strings into a single string.
- LEFT/RIGHT: Extracts a specific part of a text string.
- UPPER/LOWER: Converts all text to uppercase or lowercase.
DAX for Time-Based Analysis
One of the most interesting features of DAX is its versatility for time-based analysis. While many of the above functions are also available in SQL, the most well-known data manipulation language for relational databases, time intelligence functions are a unique feature of DAX. They enable calculations like cumulative sales, year-over-year comparisons, and other metrics requiring an understanding of time.
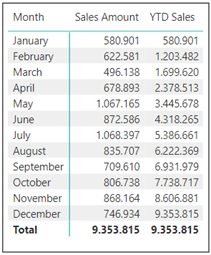
For example, if we want to calculate the cumulative Sales Amount from the beginning of the year up to the current date, we can use the DATESYTD function to achieve this calculation easily:
YTD Sales =
CALCULATE (
[Sales Amount],
DATESYTD(‘Date‘ [Date])
)
After writing this simple measure and inserting it into a matrix, we have successfully calculated Sales Amount Year To Date, which will aggregate each month with previous ones.


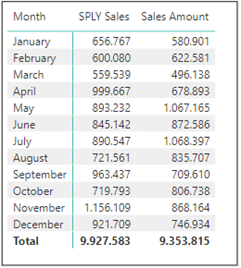
Similarly, imagine needing to calculate total sales for the current year relative to the same period in the previous year. With DAX, we can use a combination of functions like CALCULATE, FILTER, and SAMEPERIODLASTYEAR to achieve this result without needing to write complex code.
For instance:
SPLY Sales =
CALCULATE (
[Sales Amount],
SAMEPERIODLASTYEAR (‘Date‘ [Date])
)
Using SAMEPERIODLASTYEAR, we have easily obtained the result.
In the column where we introduced this measure, we’ll have Sales Amount for the same date range as the previous year.
These Time Intelligence functions are essential for analyzing trends over time and greatly simplify the process of extracting such insights.
Final Considerations
As demonstrated by these small examples, DAX is an invaluable resource for anyone working with Analysis Services, Power BI, or data analysis in general. Its ability to simplify complex calculations and offer advanced tools for time-based analysis makes it indispensable for creating detailed reports and extracting strategic insights. Like any powerful tool, it requires practice and study to master, but with the right approach, DAX can transform how we manage and interpret business data.
There are numerous online resources and tutorials available, and we recommend SQLBI’s documentation, which provides a detailed guide for each DAX function.
With a solid understanding of DAX, you can elevate your analytical capabilities and offer significant added value to your organization.
Learn DAX Language
If you want to learn the DAX language to review or adjust created measures, enroll in our course.
Visualitics Team
This article was written and edited by one of our consultants.
Share now on your social channels or via email: