Have you been tasked with using Power BI to extract insights from your company’s data but don’t know where to start? Power BI provides a crucial tool for preparing data for analysis and generating reports: Power Query.
Power Query offers powerful features for cleaning and preparing data, which are essential before creating any report.
In Power BI Desktop, you can access it via: Home > Transform Data
What is Power Query?
Power Query is a data transformation editor integrated into Excel, Power BI, and other Microsoft products.
It functions as an ETL tool (Extract, Transform, Load) for handling data. The data is loaded depending on the product where the editor is used.
The engine behind Power Query is powered by a language called M. For more complex transformations beyond the graphical interface’s capabilities, you can write transformations using the M-language in the Advanced Editor.
To begin, you must connect your data to one or more sources. Otherwise, the editor will display a blank screen.
ETL (Extract, Transform, Load)
Power Query follows the ETL process:
- Extract: Retrieve data from one or more data sources.
- Transform: Clean and structure the extracted data.
- Load: Save the transformed data to a specified destination.
What Does Power Query Do?
Data Loading
In the Power Query Editor, you can connect to data sources and start creating queries or add new data by selecting New Source. A menu appears with a list of data connectors.
You can combine data from different sources in Power Query by adding files or connections following the same procedure.

Power Query Editor
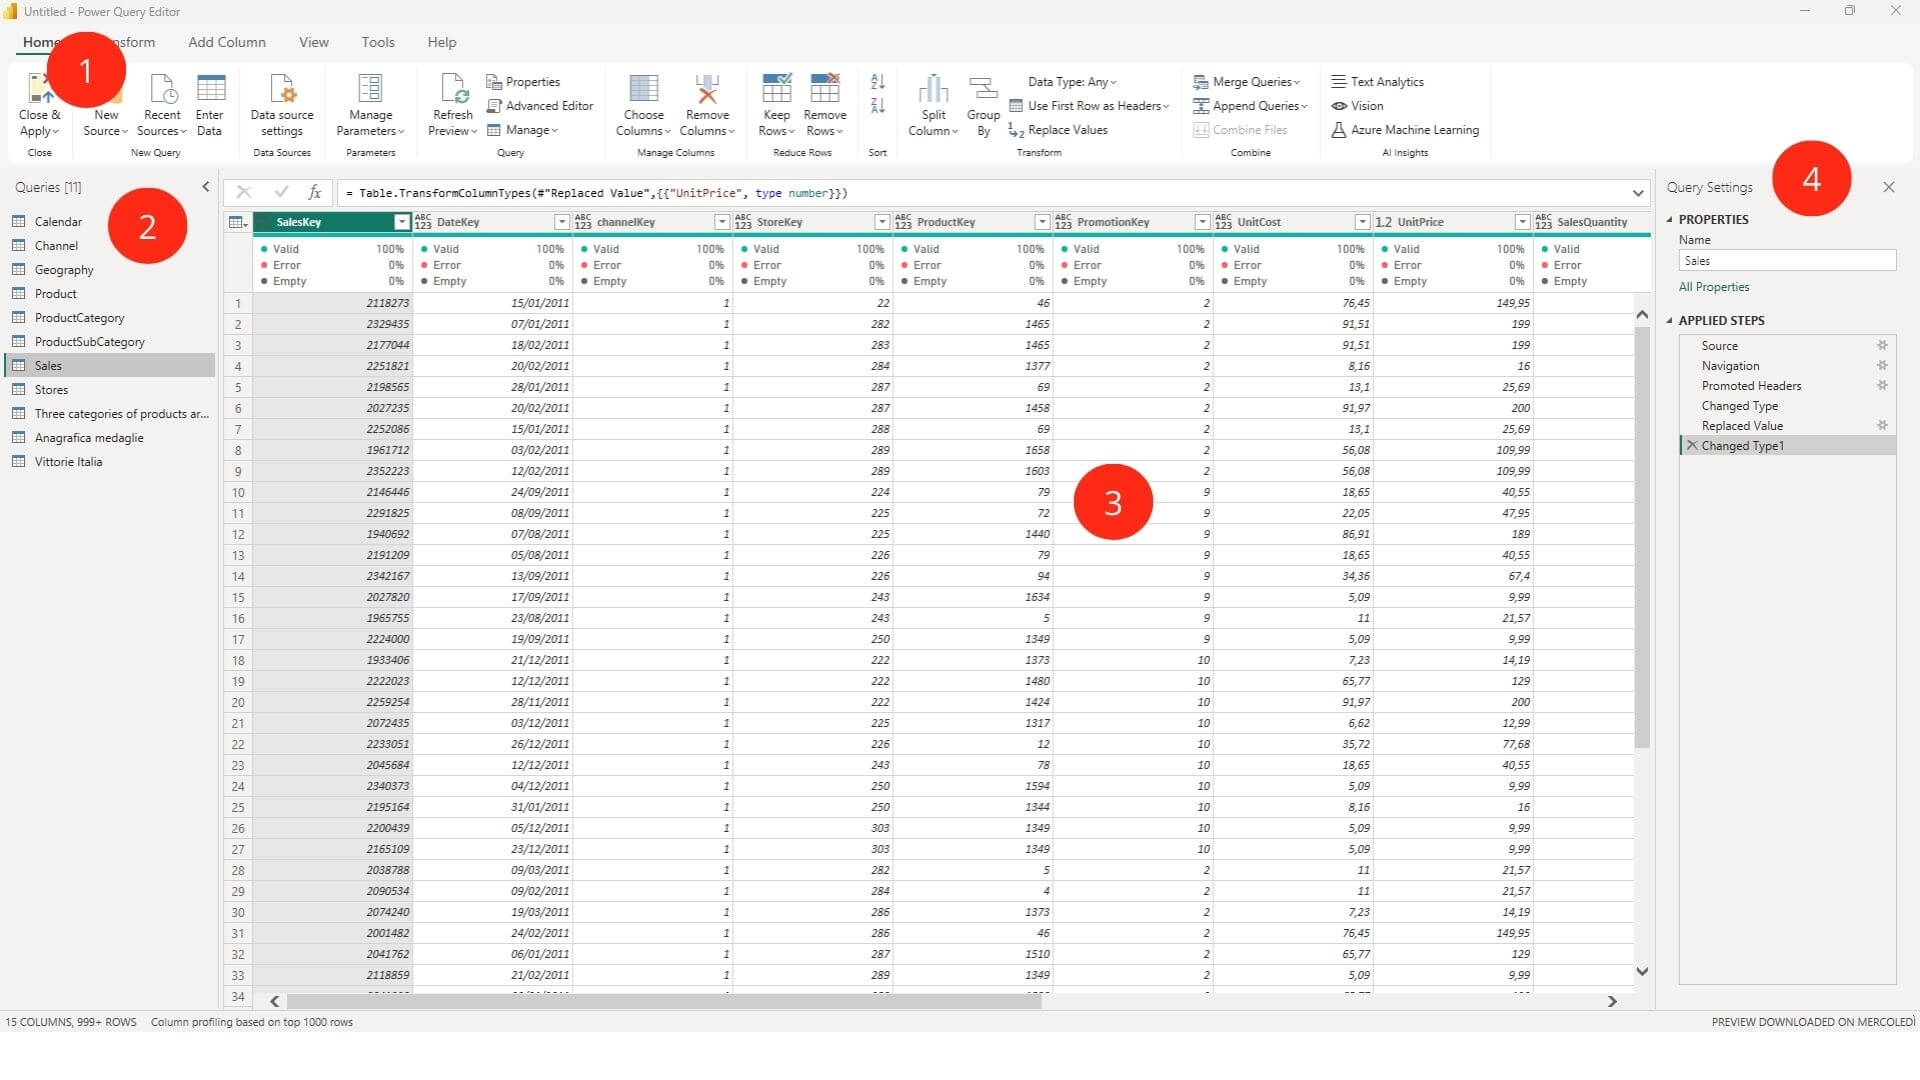
Once files or connections are added, the following elements appear in the interface:

- Ribbon: Provides tools to interact with the data.
- Queries Panel: Displays all loaded queries, allowing you to select and view them.
- Central Pane: Shows the selected queries, making them available for manipulation.
- Query Settings Panel: Lets you rename the query and view or edit applied steps. Here, you can reorder, rename, or delete steps.
Features
The ribbon provides the ability to shape our data according to a precise framework. Data modeling begins with transforming existing data, adding new elements based on the original data, and ultimately providing insights about the data itself, along with diagnostic tools and community support in case of issues. Let’s take a closer look at its structure.
In the Transform tab, you can:
- Sorting and filtering data
- Promoting rows to headers
- Adding or removing rows
- Handling duplicates
- Grouping and duplicating tables
- Pivoting and unpivoting data

In the Add Column tab, you can add new columns based on extracted query data.

Right-clicking in the central pane and selecting a column lets you perform transformations, such as changing data types via Change Type.

The Query Settings panel allows you to apply transformations to individual steps, such as renaming, deleting, or reordering them.
Important: Any changes or additions made in Power Query do not modify the underlying data source. Power Query only edits and structures how data is presented, leaving the source data untouched.
M-Language – Advanced Editor
Each transformation in Power Query is underpinned by M-language, a robust and expressive data mashup language.

You can also access the Advanced Editor via Home > Advanced Editor when user interface tools are insufficient for specific modifications.
Why is Power Query Important?
Power Query is a powerful tool that reduces the time spent on data preparation, accelerating analysis and decision-making. It is integrated into several Microsoft tools to streamline workflows.
Once all necessary transformations and table combinations are complete, you can save and apply the changes directly to Excel. From there, you can:
- Continue working in Excel or Power Pivot.
- Transition to Power BI Desktop for further data modeling, creating visualizations and reports, and defining calculations in DAX.
Differences Between Power BI and Excel
Power Query in Power BI is more robust and flexible, offering advanced capabilities, better data model management, and centralized sharing options. In contrast, Power Query in Excel focuses on preparing data for spreadsheet analysis.
In Excel, sharing is done via Excel files, which can be less effective for real-time collaboration or centralized report sharing.
Learn Power Query Language
If you want to learn the Power Query language to cleaning and preparing your data.
Visualitics Team
This article was written and edited by one of our consultants.
Share now on your social channels or via email: