How to create a Waterfall Chart in Tableau
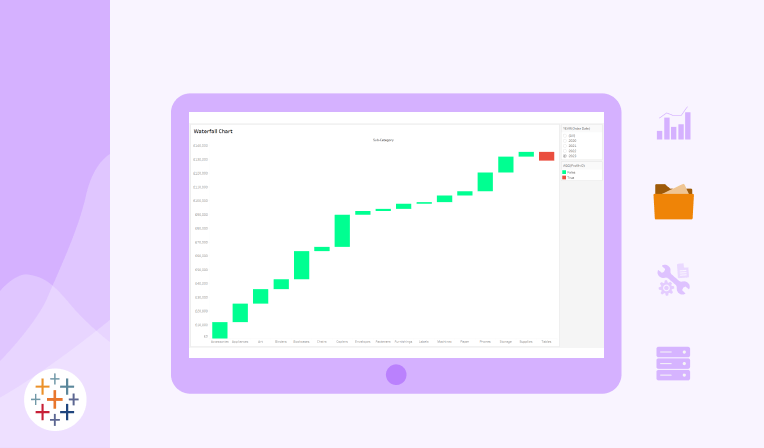
A waterfall chart is a powerful visualization that shows how positive and negative values contribute to a total. This guide will teach you step by step how to build a waterfall chart using Tableau to best represent your data trends. What is a Waterfall Chart? A waterfall chart is a type of chart that represents the […]