In the rapidly evolving digital age, data visualization has become a cornerstone for understanding complex information. However, traditional methods of presenting data can often be dry and uninspiring. This is where gamification steps in, transforming data visualization into an engaging, interactive, and educational experience. By integrating game design elements into data visualization, we can create a more immersive environment. This approach not only captures attention but also enhances the understanding and retention of information, as we discussed in our previous article on Data Visualization as an Educational Tool.
What is Gamification?
Gamification involves applying game-like elements such as point scoring, leaderboards, challenges, and rewards to non-game contexts. The primary goal is to increase user engagement, motivation, and participation. When applied to data visualization, gamification can make the process of exploring and understanding data more interactive and enjoyable.
Benefits of Gamification in Data Visualization:
- Increased Engagement: gamification transforms passive data consumption into an active process. Users become participants rather than mere observers, which can significantly increase their interest and engagement.
- Enhanced Learning: by incorporating challenges and interactive elements, gamified data visualizations can improve learning outcomes. Users are more likely to remember information they actively engage with.
- Motivation and Retention: game elements such as rewards and achievements can motivate users to spend more time with the data, leading to better retention and understanding.
- Encourages Exploration: gamification encourages users to explore data more thoroughly. Interactive elements can guide users through data sets, highlighting important insights and trends.

Examples of Gamification in Data Visualization

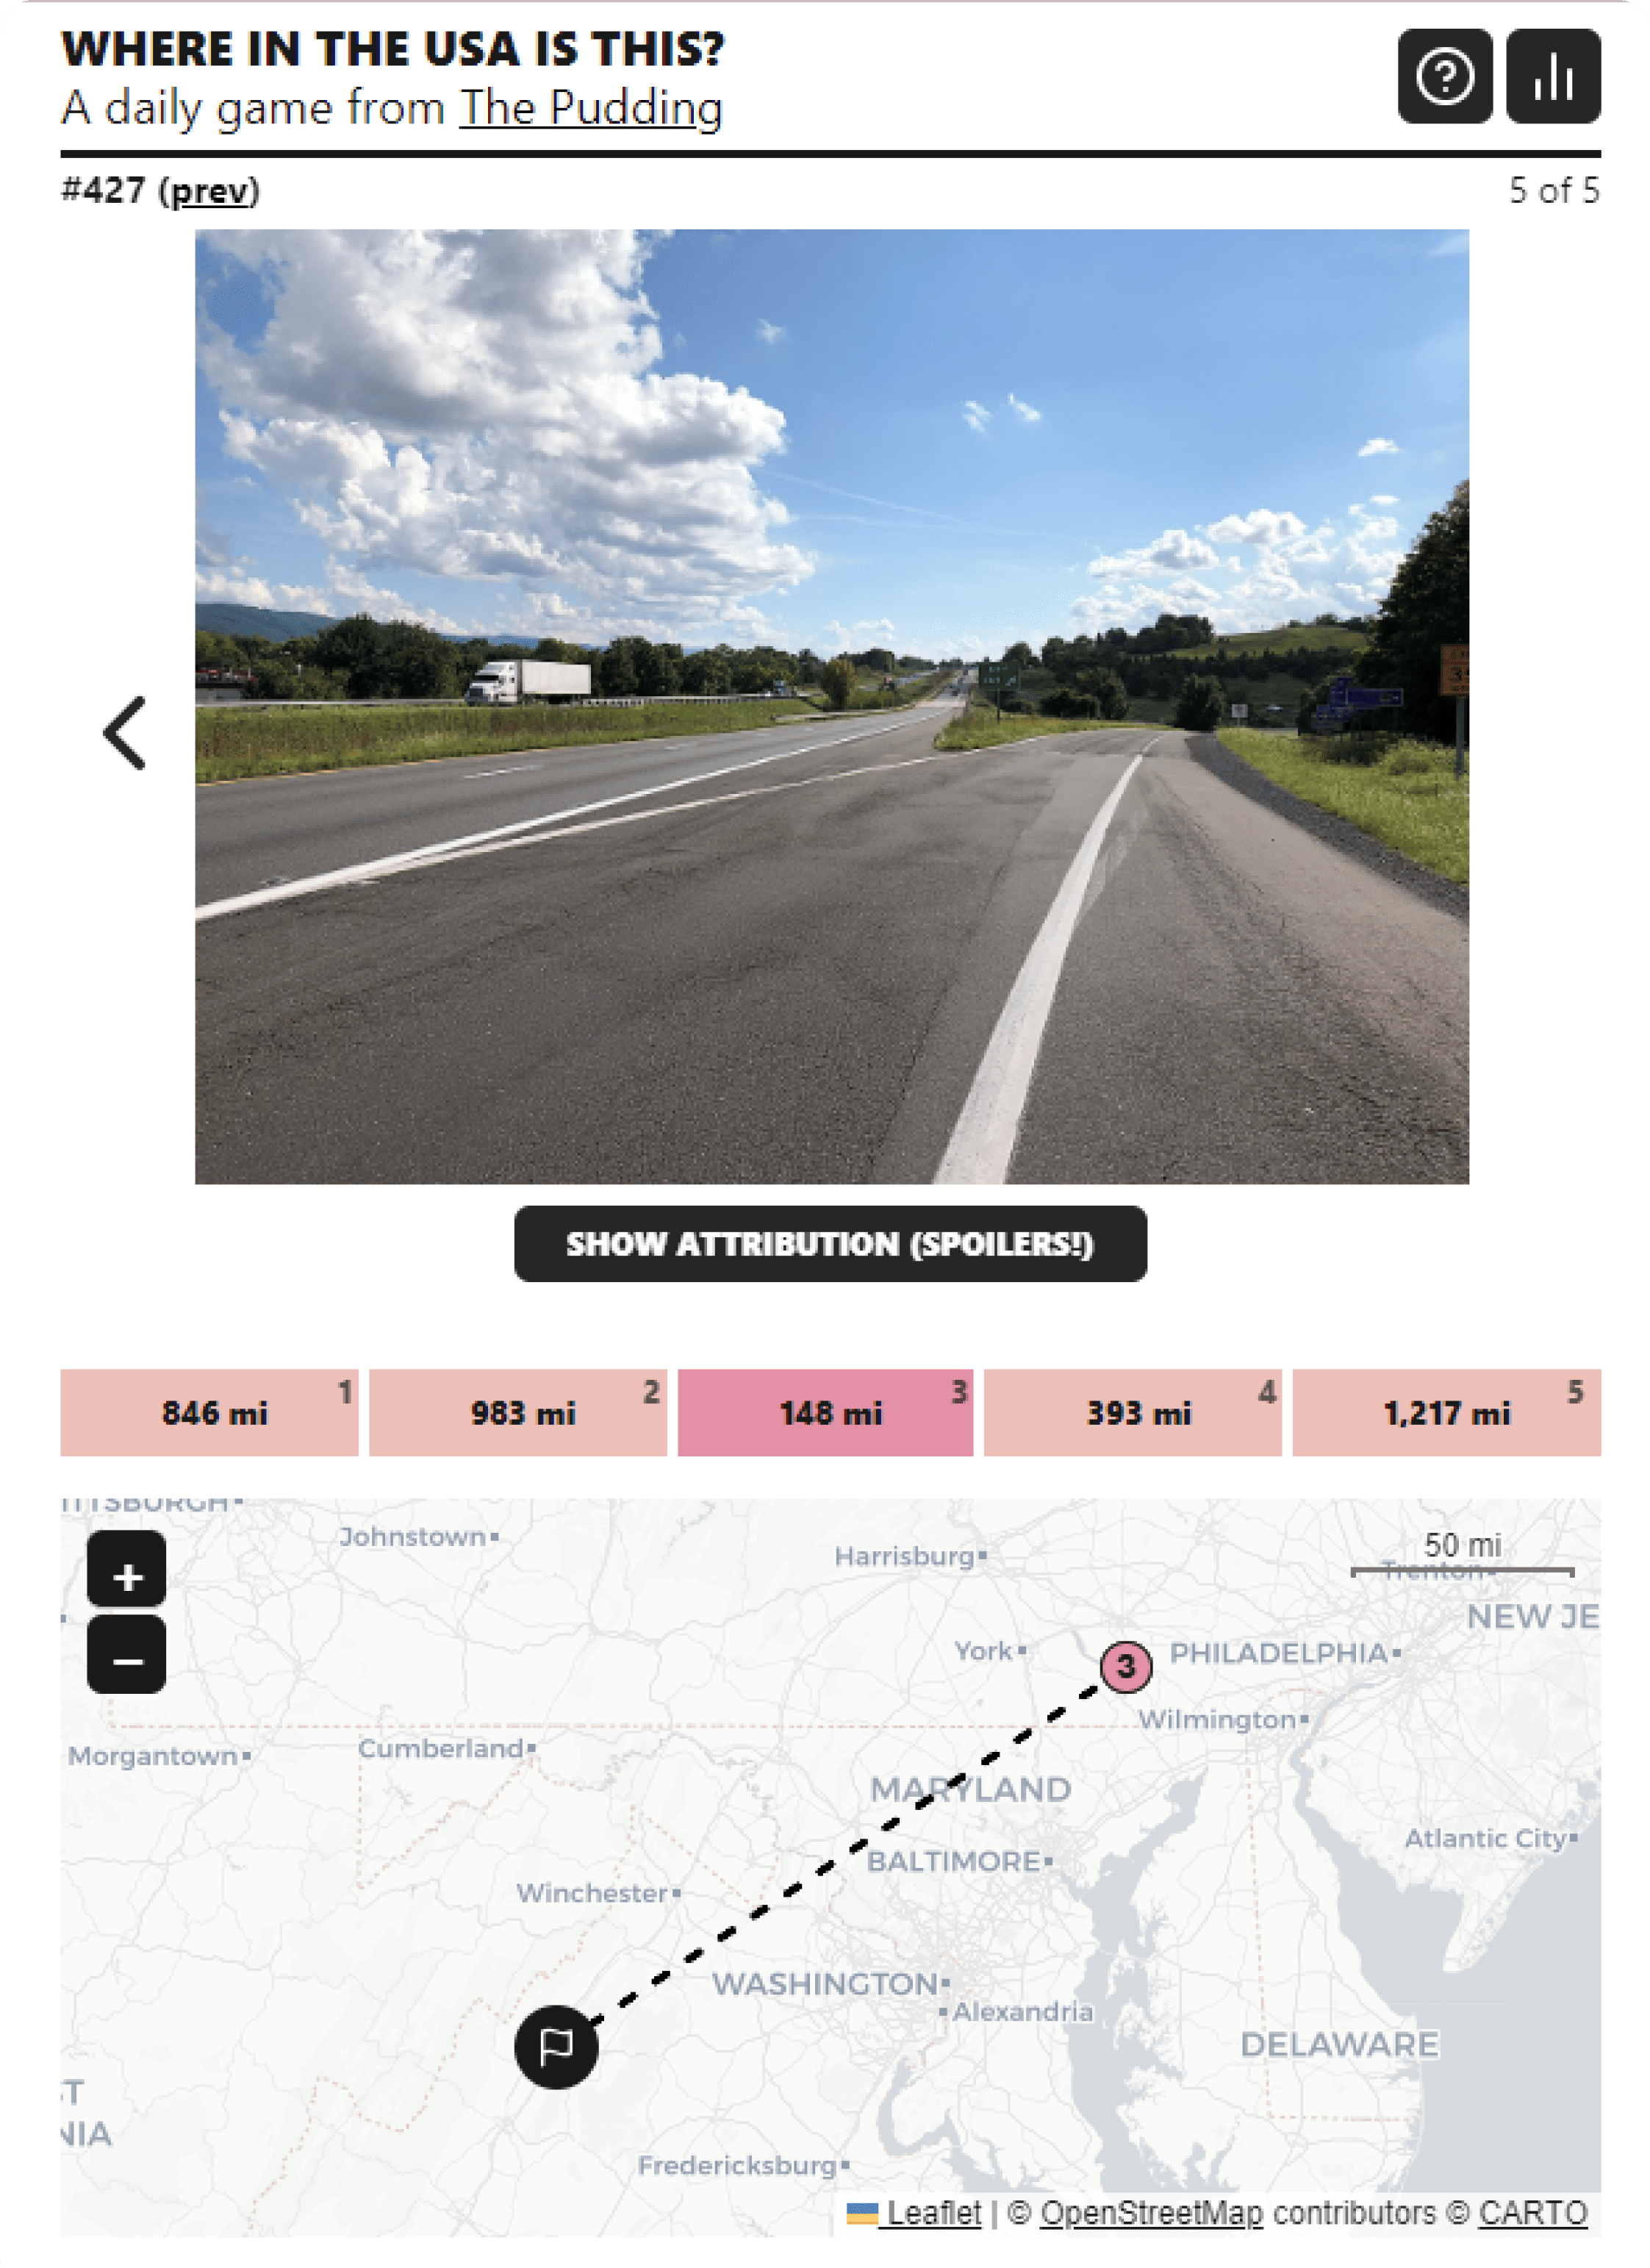
Where in the World: this game invites players to guess the locations of various photos from around the globe by placing points on a map. Players earn points based on how close their guesses are to the actual locations, with immediate feedback for each guess. This engaging game makes geography interactive and fun. It challenges users to identify landmarks, landscapes, and cultural features from around the world, enhancing their experience through exploration and discovery.
This is a Teenager: The Pudding’s interactive game follows the lives of teenagers over 24 years, based on adverse childhood experiences. It shows how factors such as disengaged parents, school difficulties, bullying, and poverty affect their future outcomes. These outcomes relate to education, income, health, and happiness. This gamified data visualization makes complex data more understandable and engaging, improving comprehension and retention. It allows users to actively explore and interact with the simulated life events of these teenagers.

Some Examples of Educational Games Focused on Data Visualization
One of the most effective applications of gamification in data visualization is in educational tools for children. For example, a series of games designed to teach kids about different types of charts can make learning about data fun and engaging.


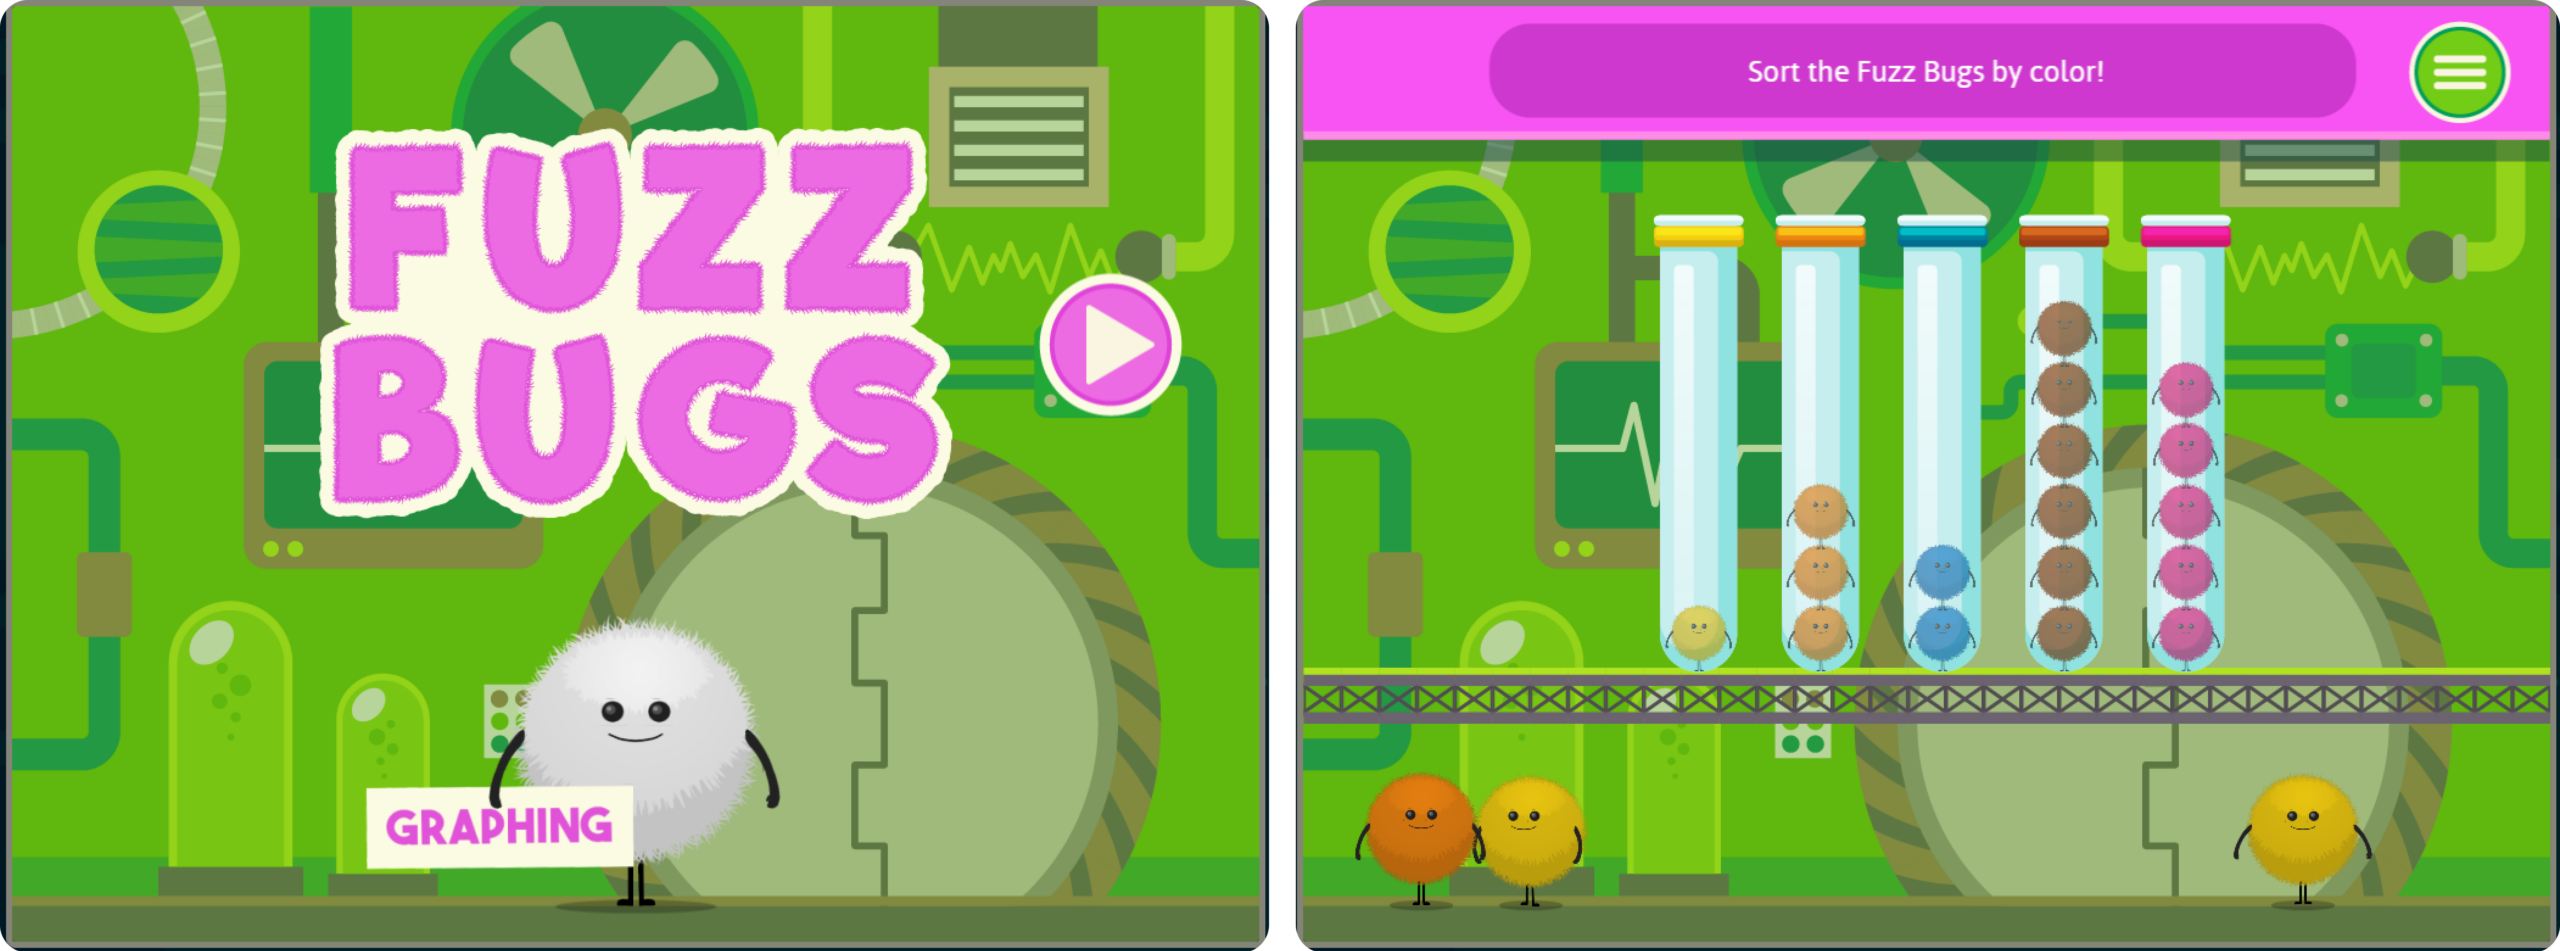
Fuzz Bugs Graphing: is an educational game on ABCya where players use Fuzz Bugs to create and interpret different types of graphs. Players collect Fuzz Bugs of various colors and sort them into graphs like bar graphs, pictographs, and line plots. The game teaches children how to count, categorize, and visually represent data while making learning fun and interactive.

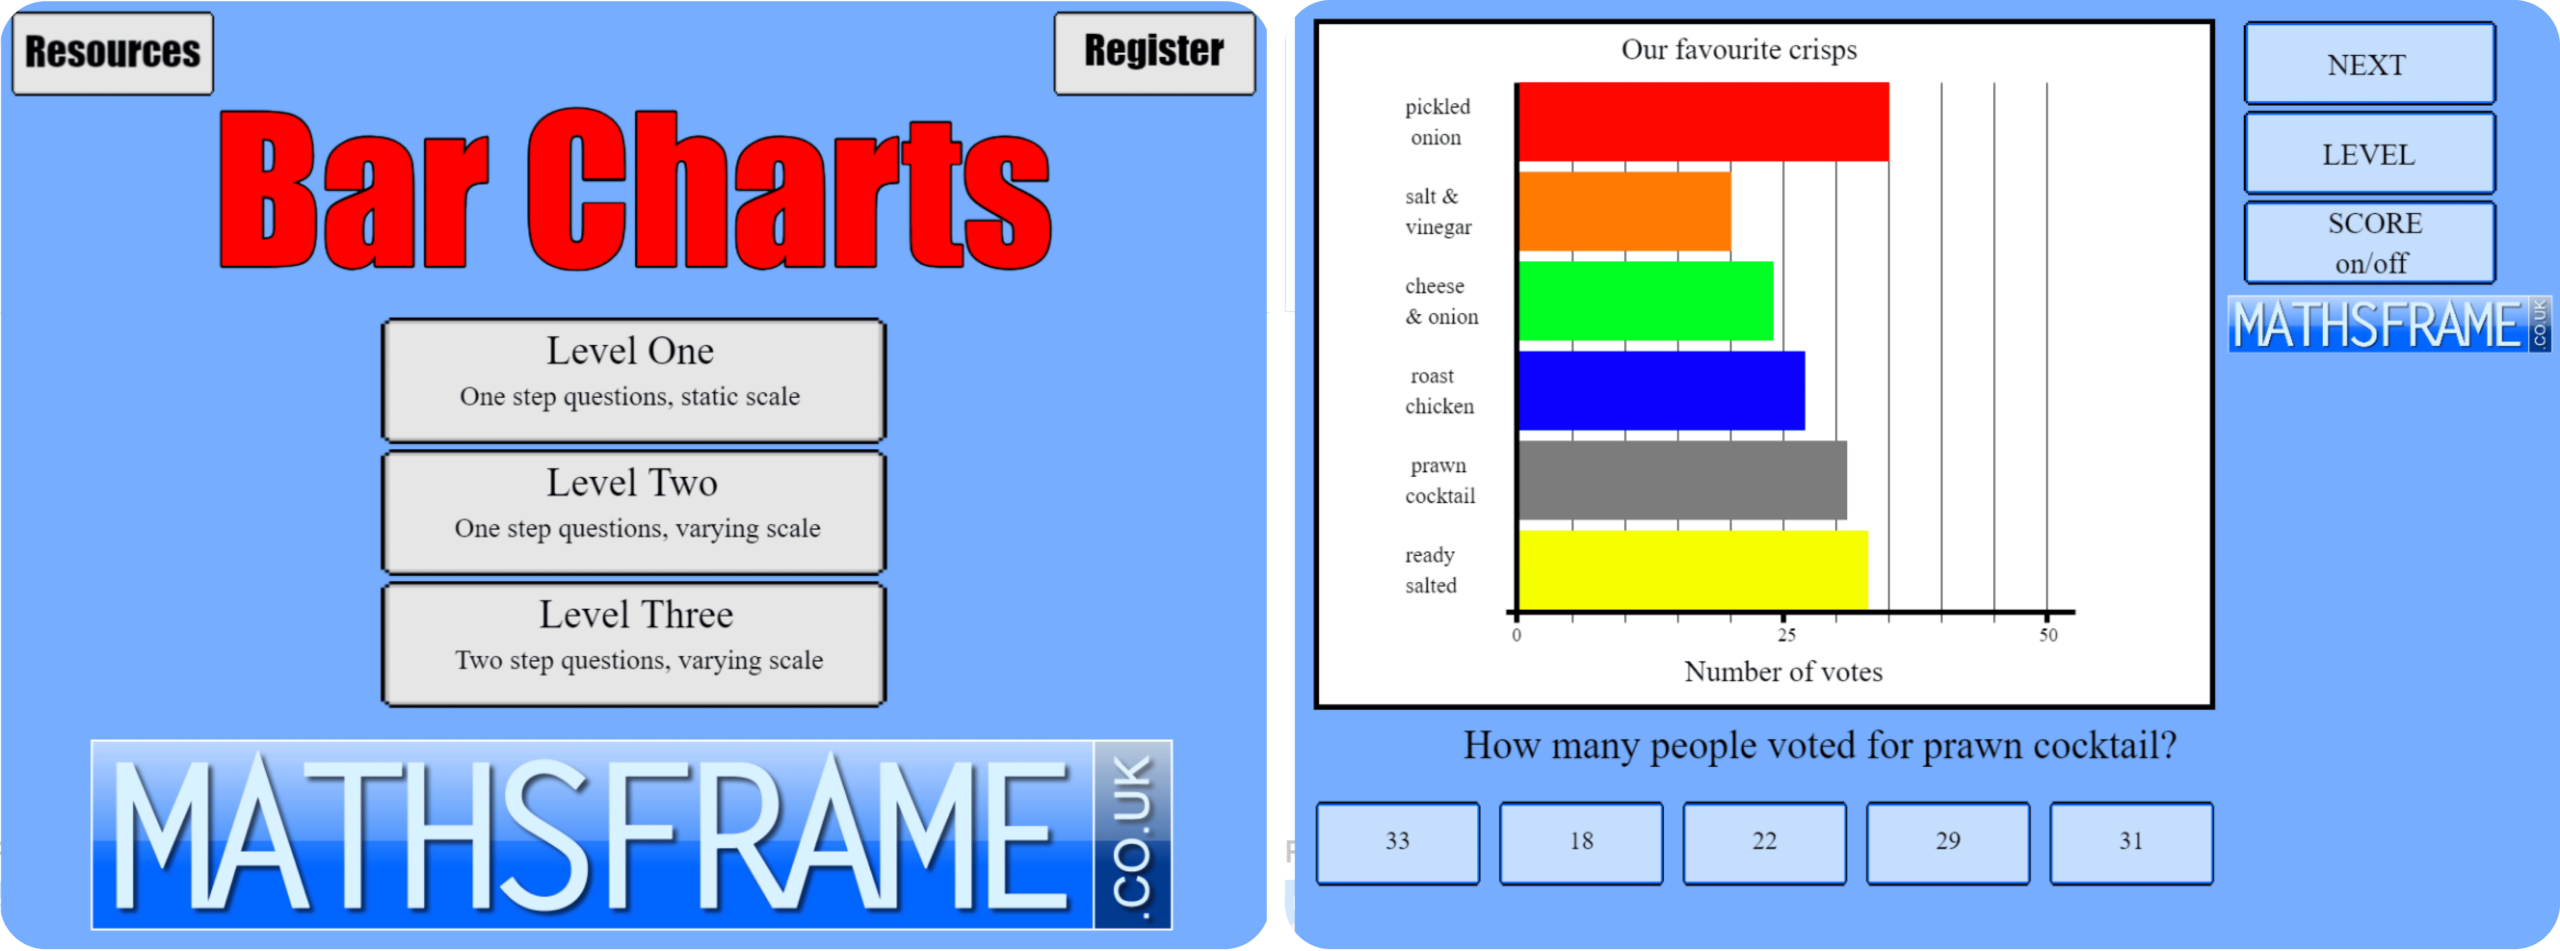
Bar Charts: this game on Mathsframe is designed to help children interpret and present data using bar charts. It includes both vertical and horizontal bars and features a variety of one-step and two-step questions. The game aligns with the UK National Curriculum for Year 3 and Year 4, focusing on skills such as collecting, organizing, and interpreting data. The game is tablet-friendly and works on any device.

Data Discovery Safari - Powered By Visualitics
Visualitics presents “Data Discovery Safari” an innovative example of gamification in data visualization.
Click on the image below to try the game and immerse yourself in an interactive discovery adventure!
- Line Chart Game with a Monkey: in this game, kids help a monkey measure banana trees by correctly interpreting line charts that show the tree’s growing path. The game introduces the concept of trends and helps children understand how data points are connected over time.
- Pie Chart Game with a Tiger: here, children help a tiger to distribute gem stones which has founded as a treasure by interpreting pie charts. This game teaches kids about proportions and how different categories contribute to a whole.
- Bar Chart Game with a Giraffe: in this game, a giraffe needs help categorizing number of fruits. Kids learn to compare quantities using bar charts, understanding which fruit is majority.
- Tree Map Game with a Bird: a bird character guides children to distribute different colors of furs. This game helps kids understand different parts within the hierarchy to allow easy comparison and pattern identifying.

Conclusions
Gamification in data visualization represents a powerful tool for making complex information more engaging and understandable. By incorporating elements of play, we can transform the way people interact with data, fostering a deeper connection and better comprehension. Whether in educational settings, corporate environments, or public awareness campaigns, gamified data visualizations can drive engagement, enhance learning, and motivate users to explore data in meaningful ways. As technology continues to evolve, the potential for gamification in data visualization will only expand, opening new avenues for innovation and impact.
Explore our articles on Data Visualization
Curious about Data Viz? Explore the World through data.

Visualitics Team
This article was written by one of our team experts.
Share this article now:
