Dot maps are a great way to visualise where the highest concentration of data is located on a map.
Let us then see how to build step-by-step a dot map showing sales by city and state on the US map from the Sample Superstore data.
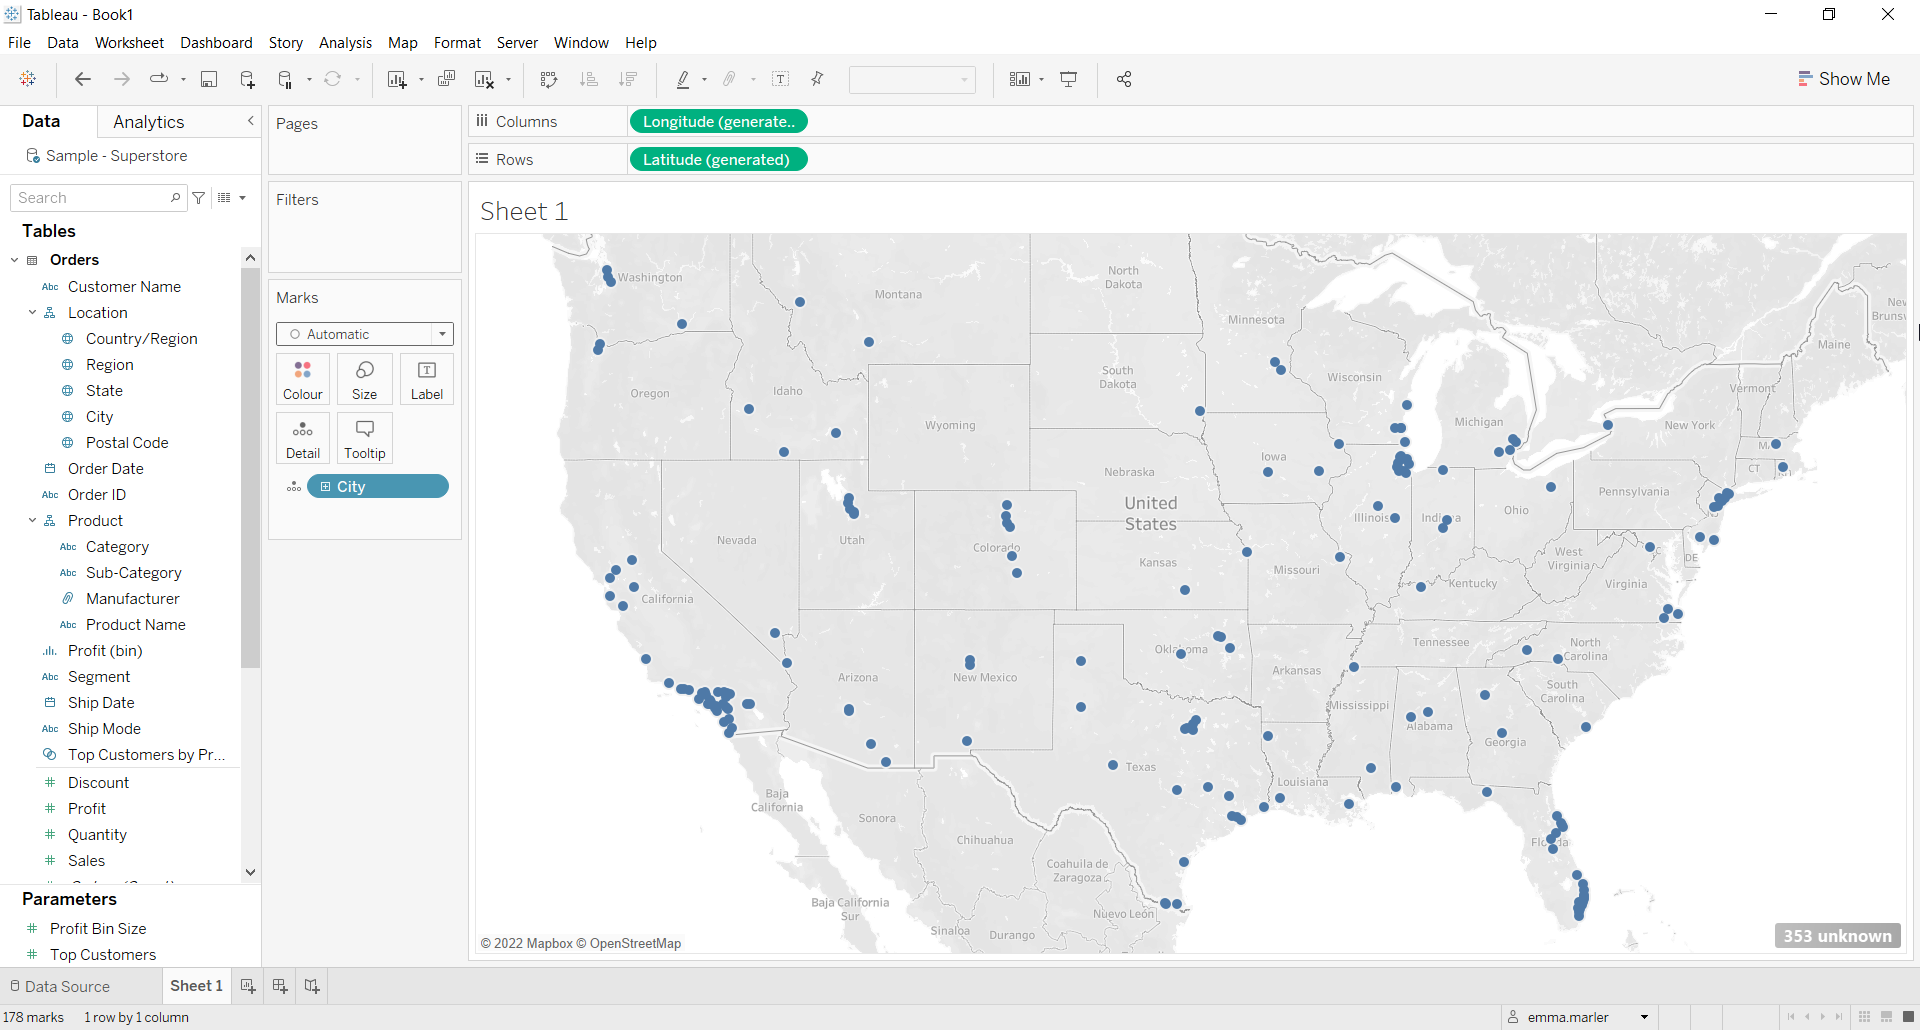
Step 1. Create a dot map
- Connect to the data source Sample – Superstore.
- Drop City on the view. A map with dots will appear. On the lower right side, you will notice a number of unknowns.
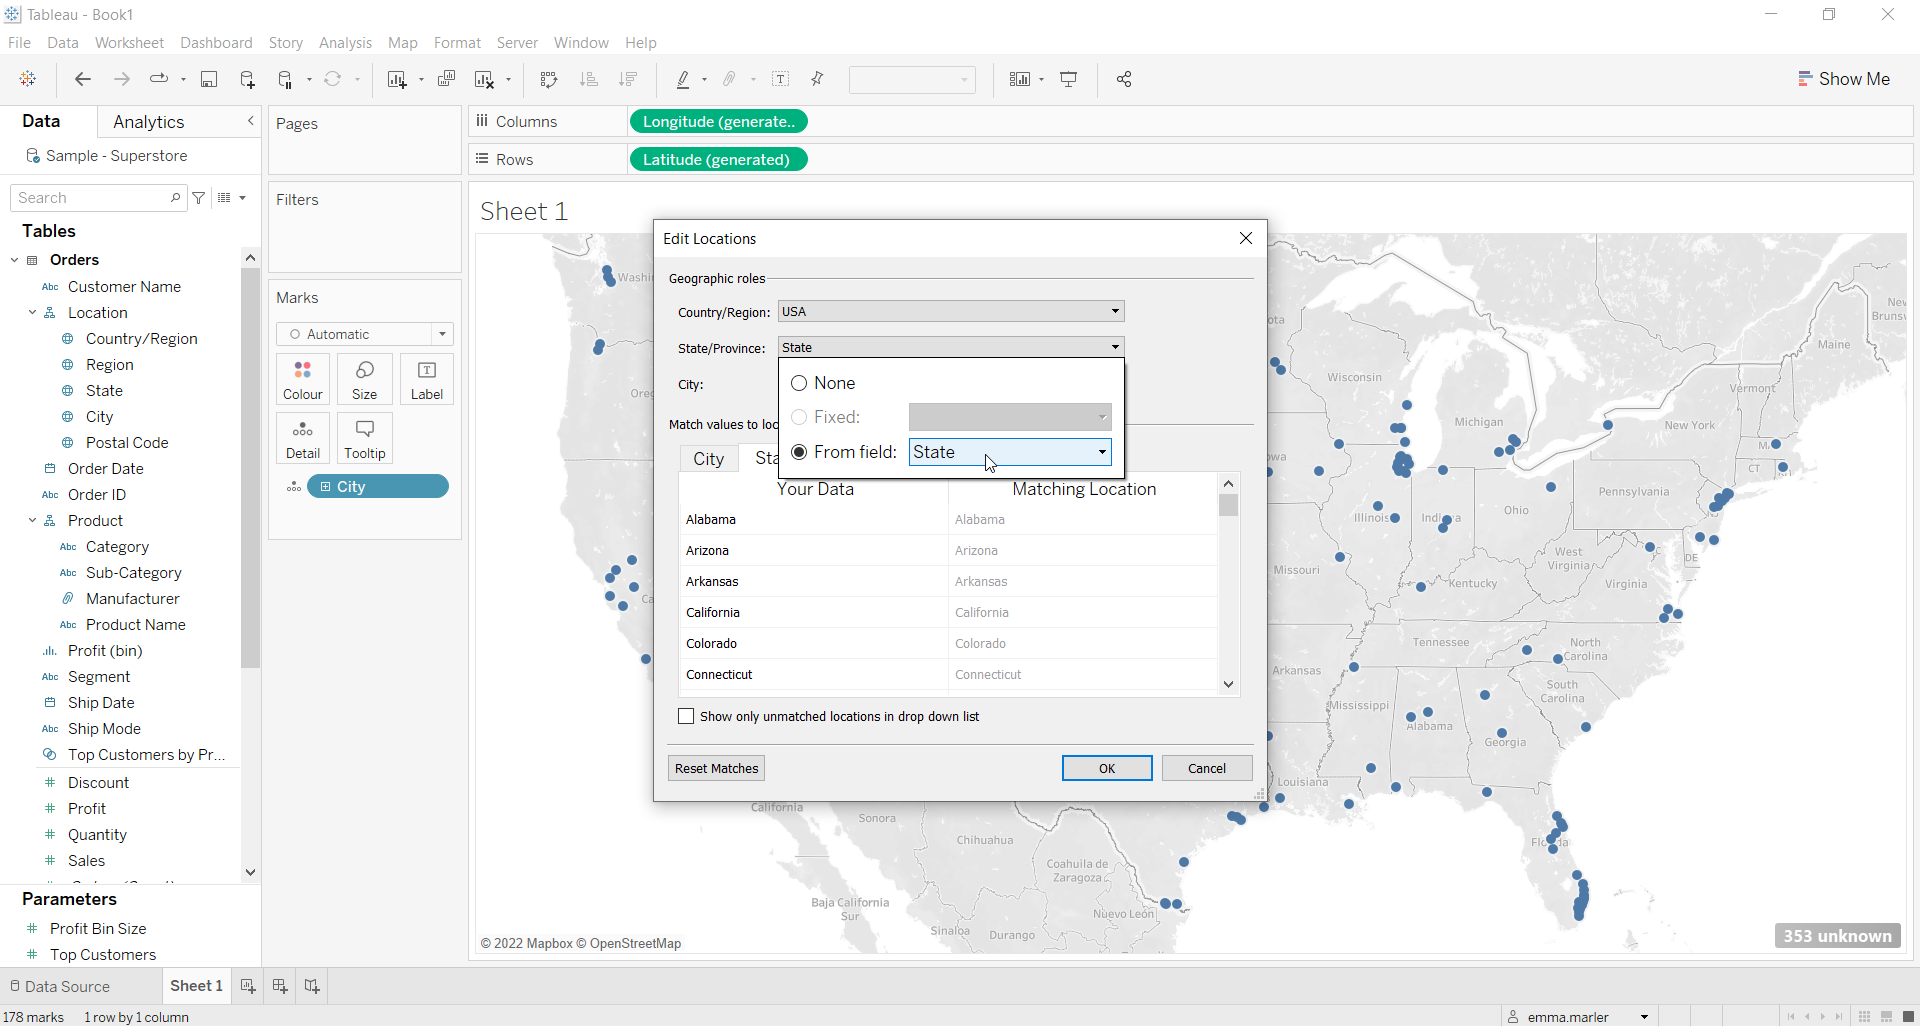
- Click on the number of unknowns. Select Edit locations. In the State/Province dropdown menu, select From Field: State.
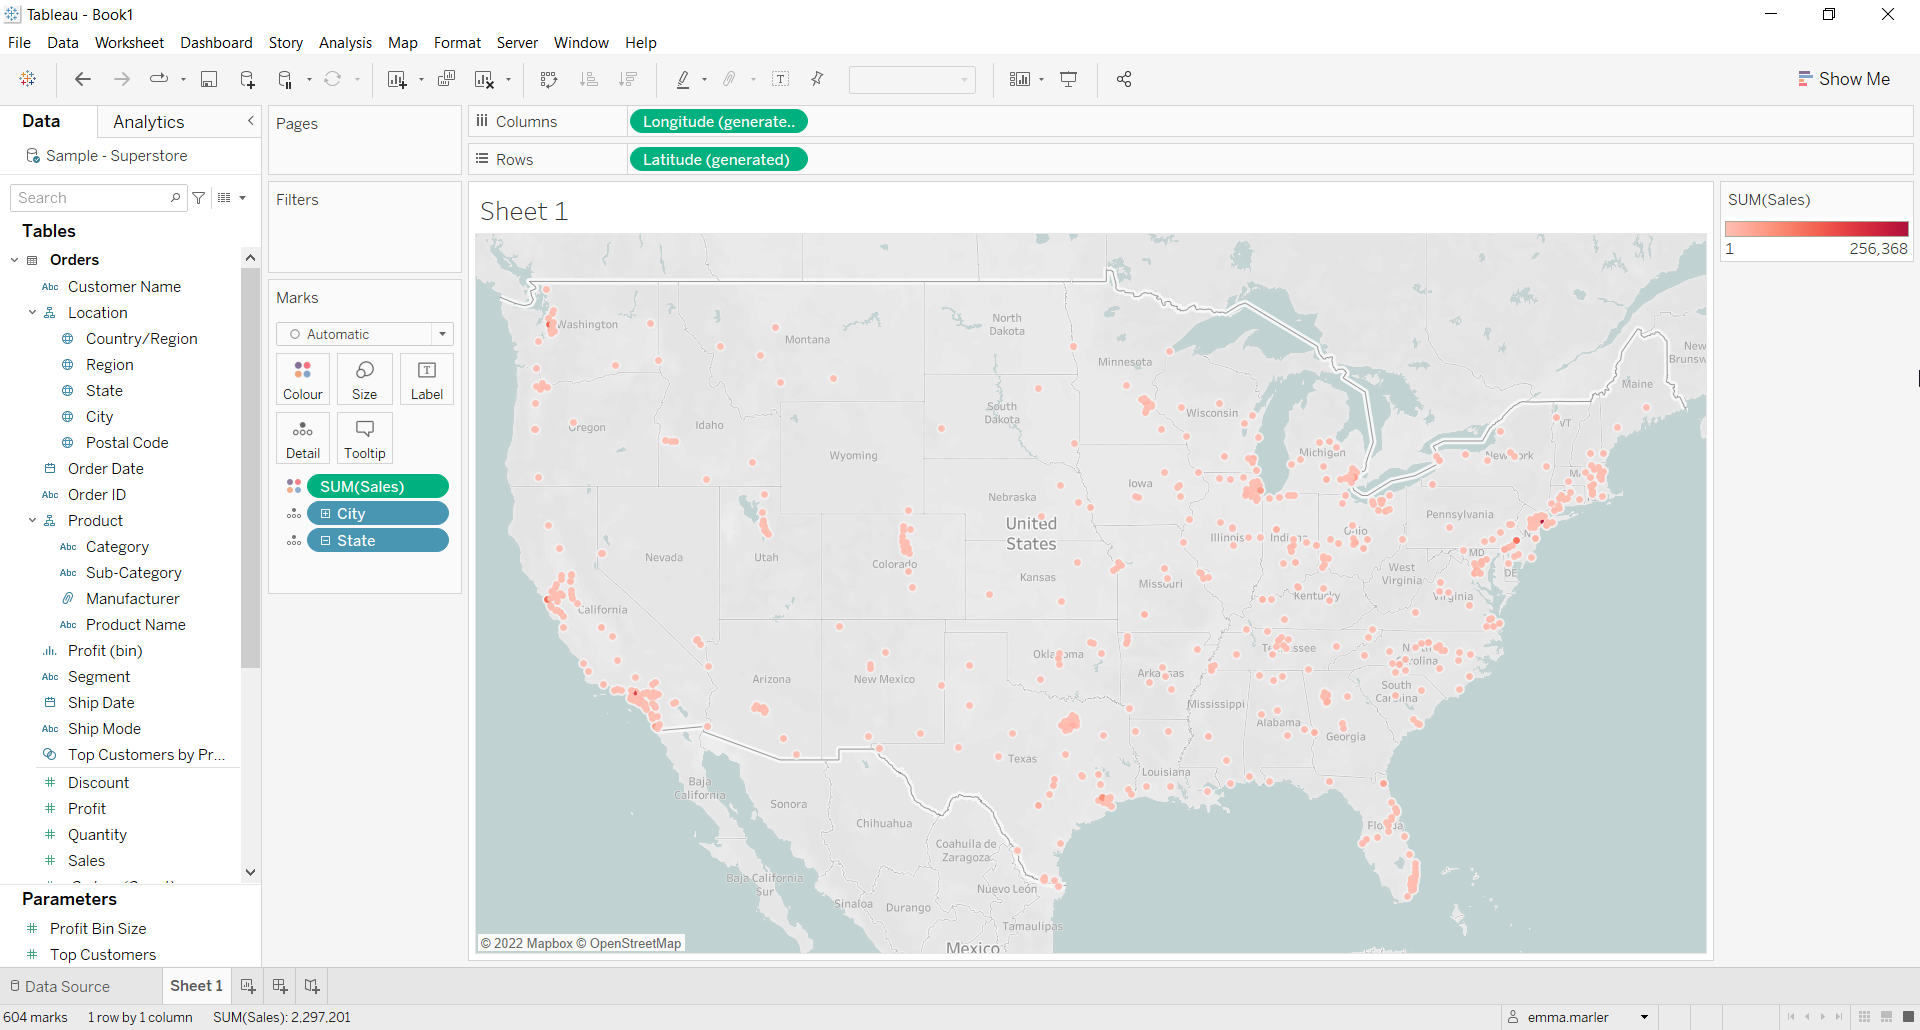
- Reduce the size of the dots from Size in the Marks card.
- Drag Sales on Color in the Marks card. You can change the color of the dots if you wish.
- Click at the top on Map > Background layers. Select Normal in Style. Done!
Don’t wait! Contact us to learn more and continue to follow upcoming news on our website and LinkedIn channel.