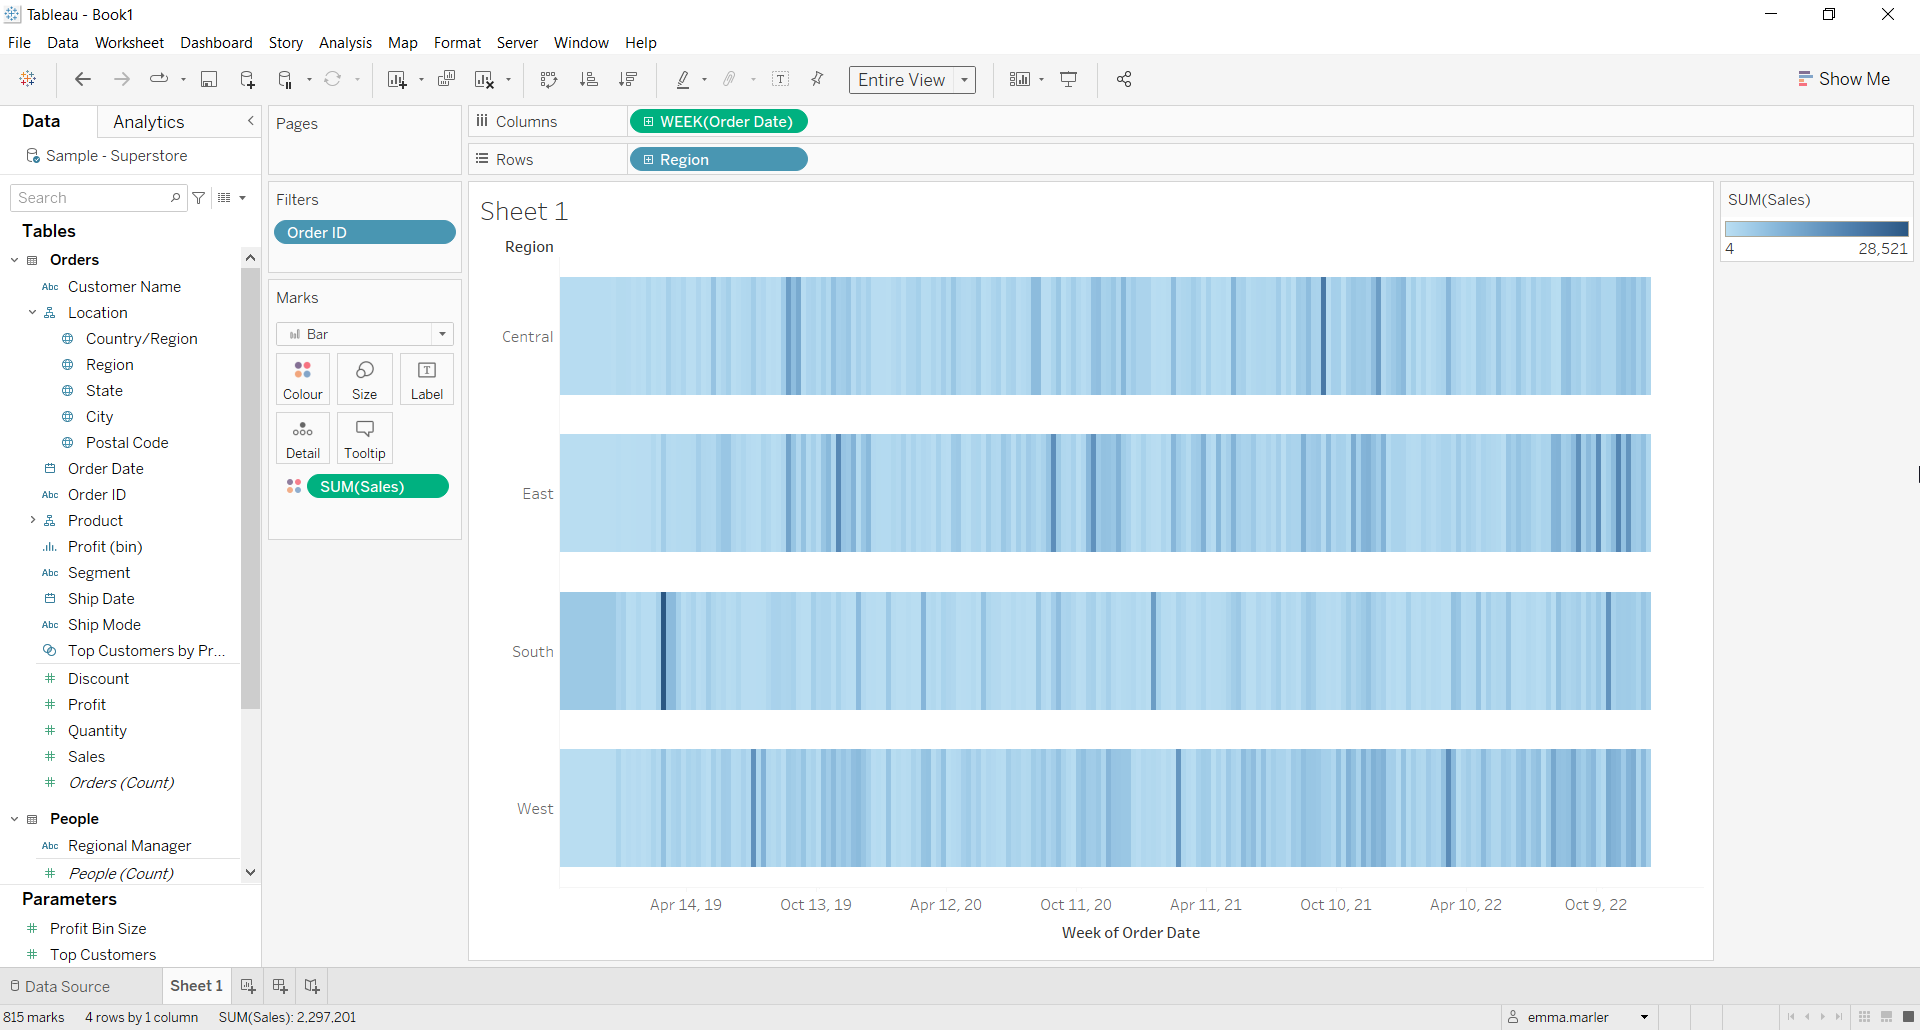
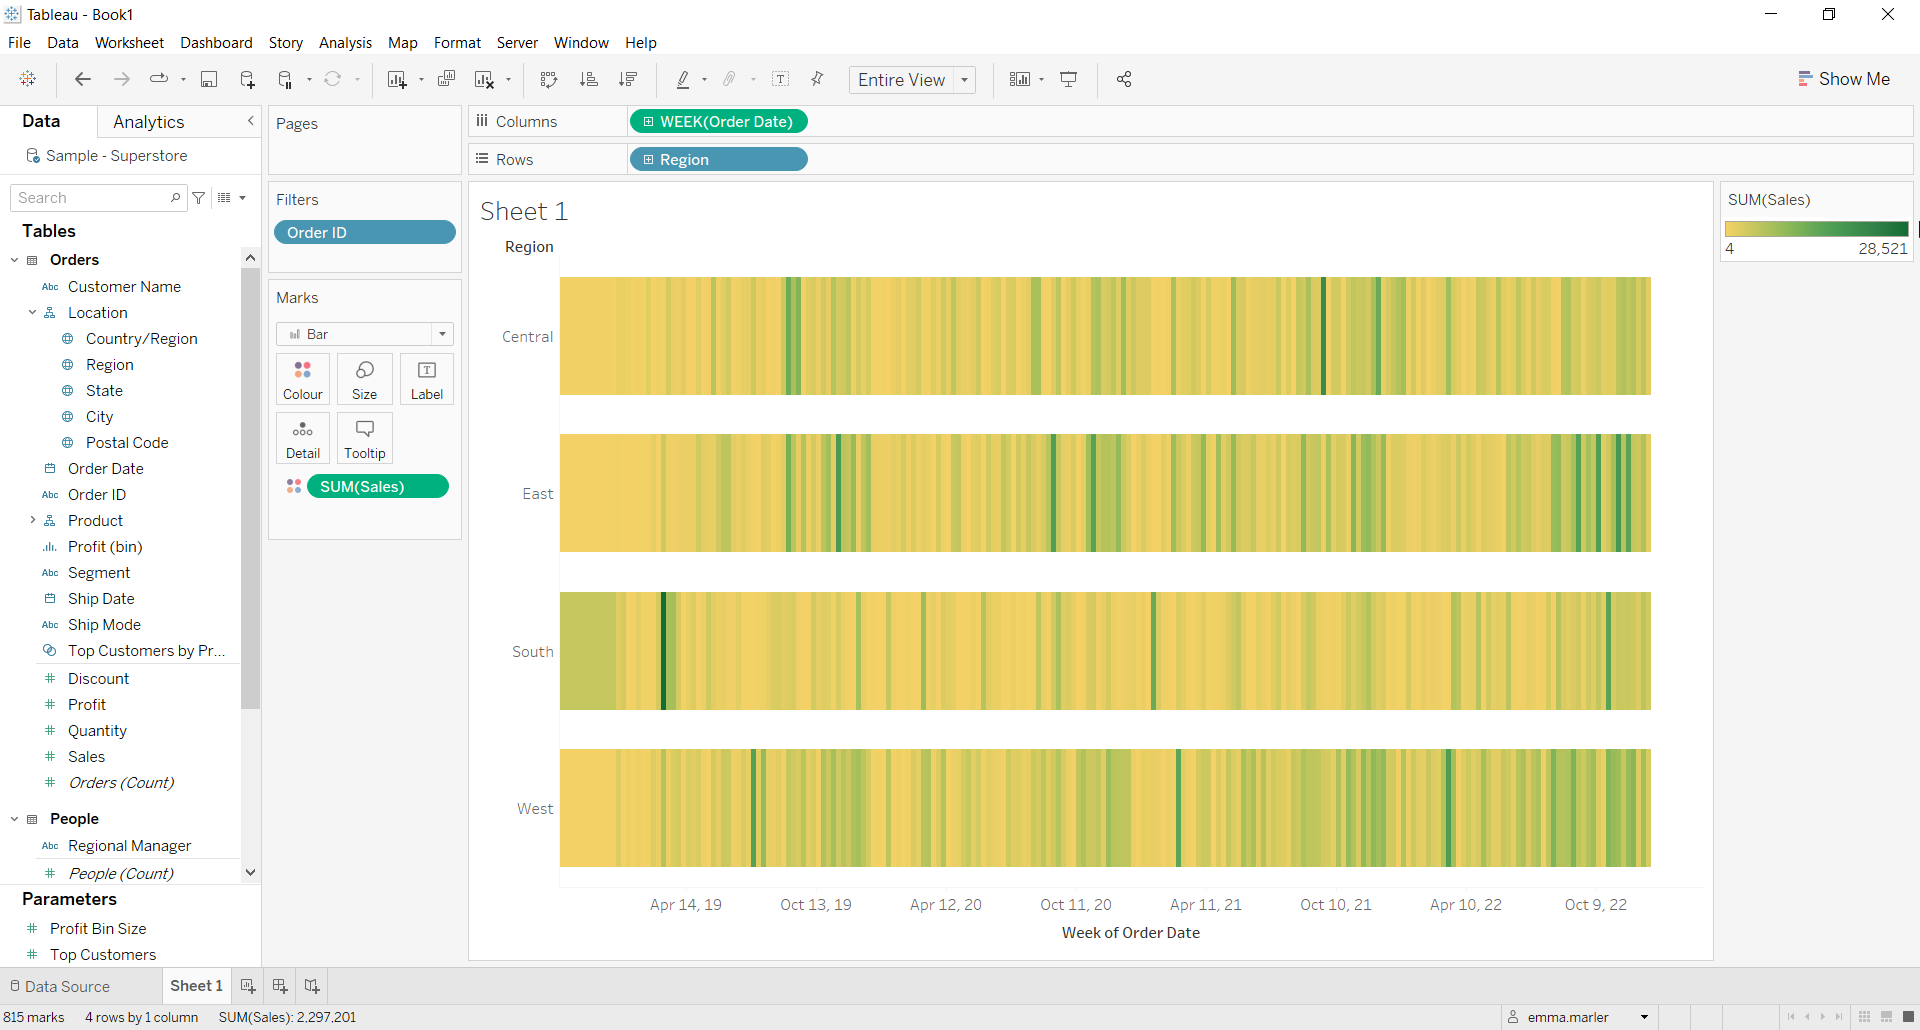
A heatmap is a graphical representation of data using a color-coded system. It allows you to immediately visualize where data is concentrated.
Let us then see how to build step-by-step a heatmap on Tableau. Our goal is to create a heatmap showing the concentration of sales per week and region from the Sample Superstore data.
Step 1. Create a table
- Connect to the data source Sample – Superstore.
- Drag Order Date onto Columns. Right click on it and select Week Number Week 5, 2015.
- Drag Region on Rows.
- Drag Sales on Color in the Marks card.
- Select Bar in the dropdown menu in the Marks card and fit to Entire View in the toolbar.

- Click on Color in the Marks card, then Edit Colors and select Green-Gold in the dropdown menu. There you go!

Don’t wait! Contact us to learn more and continue to follow upcoming news on our website and LinkedIn channel.