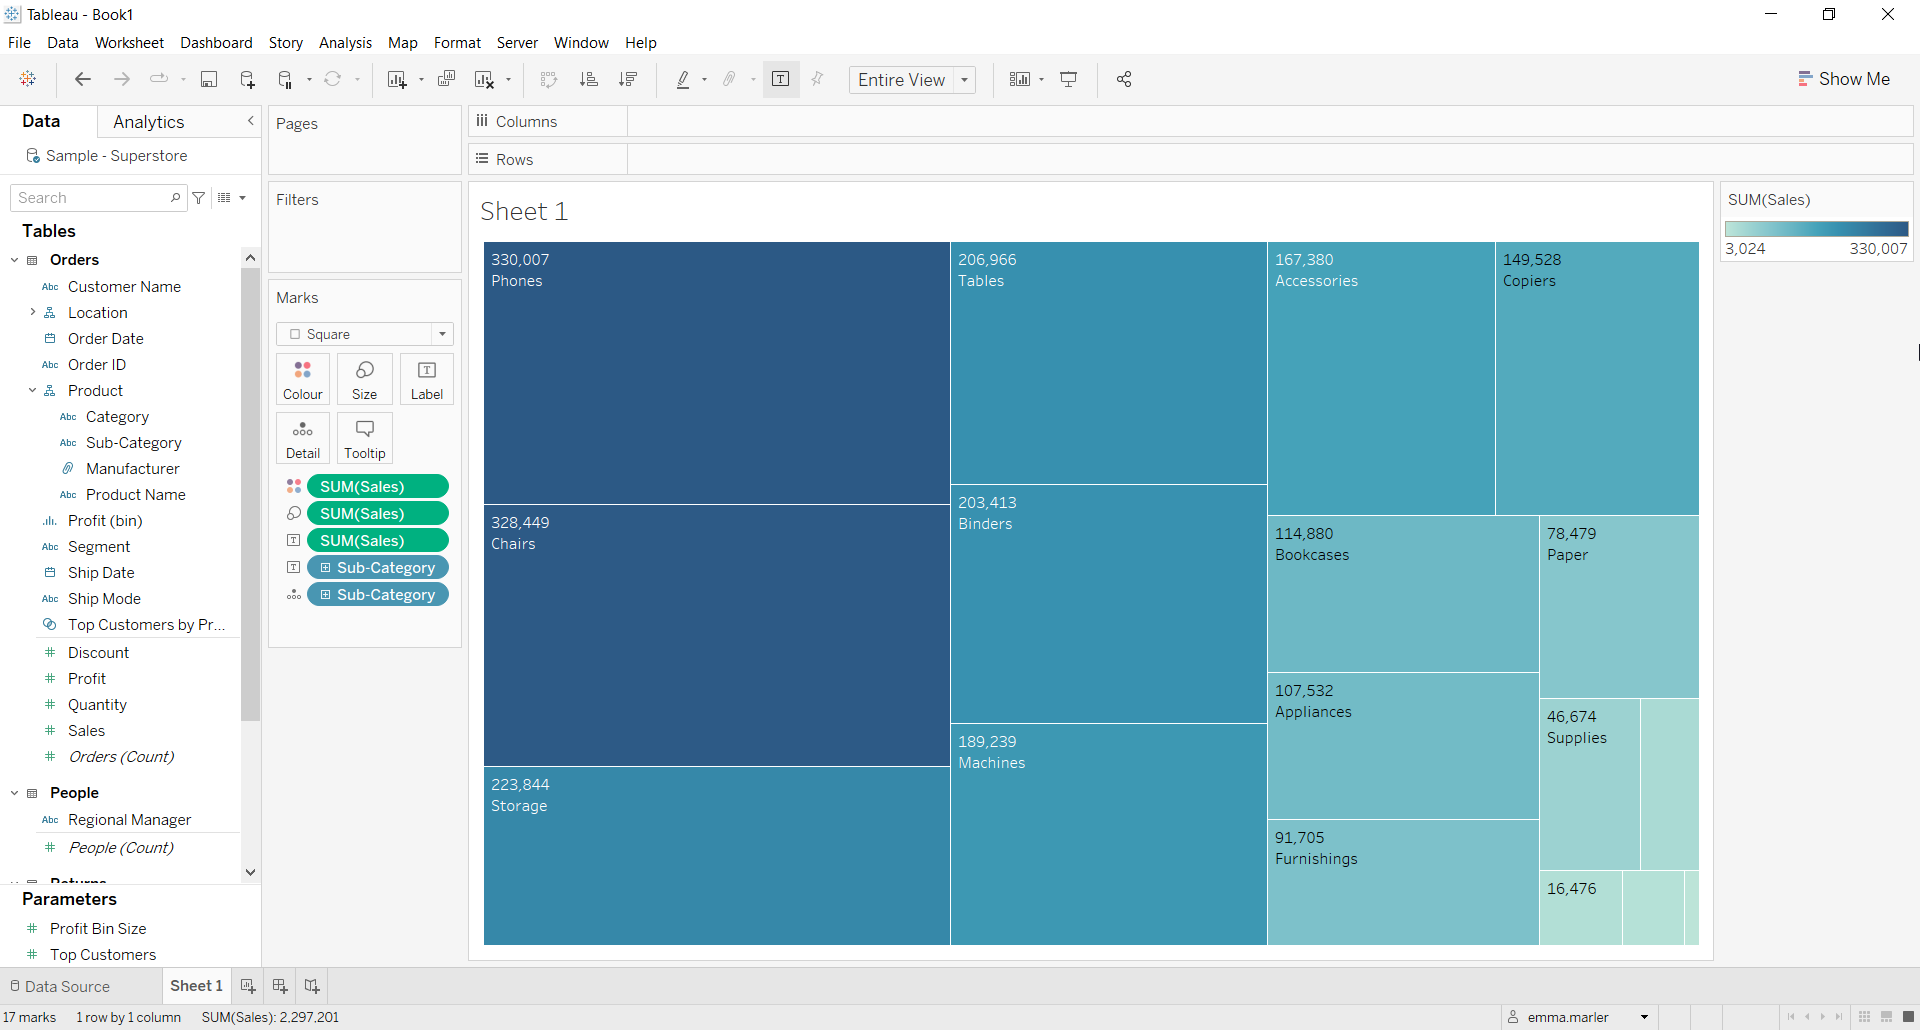
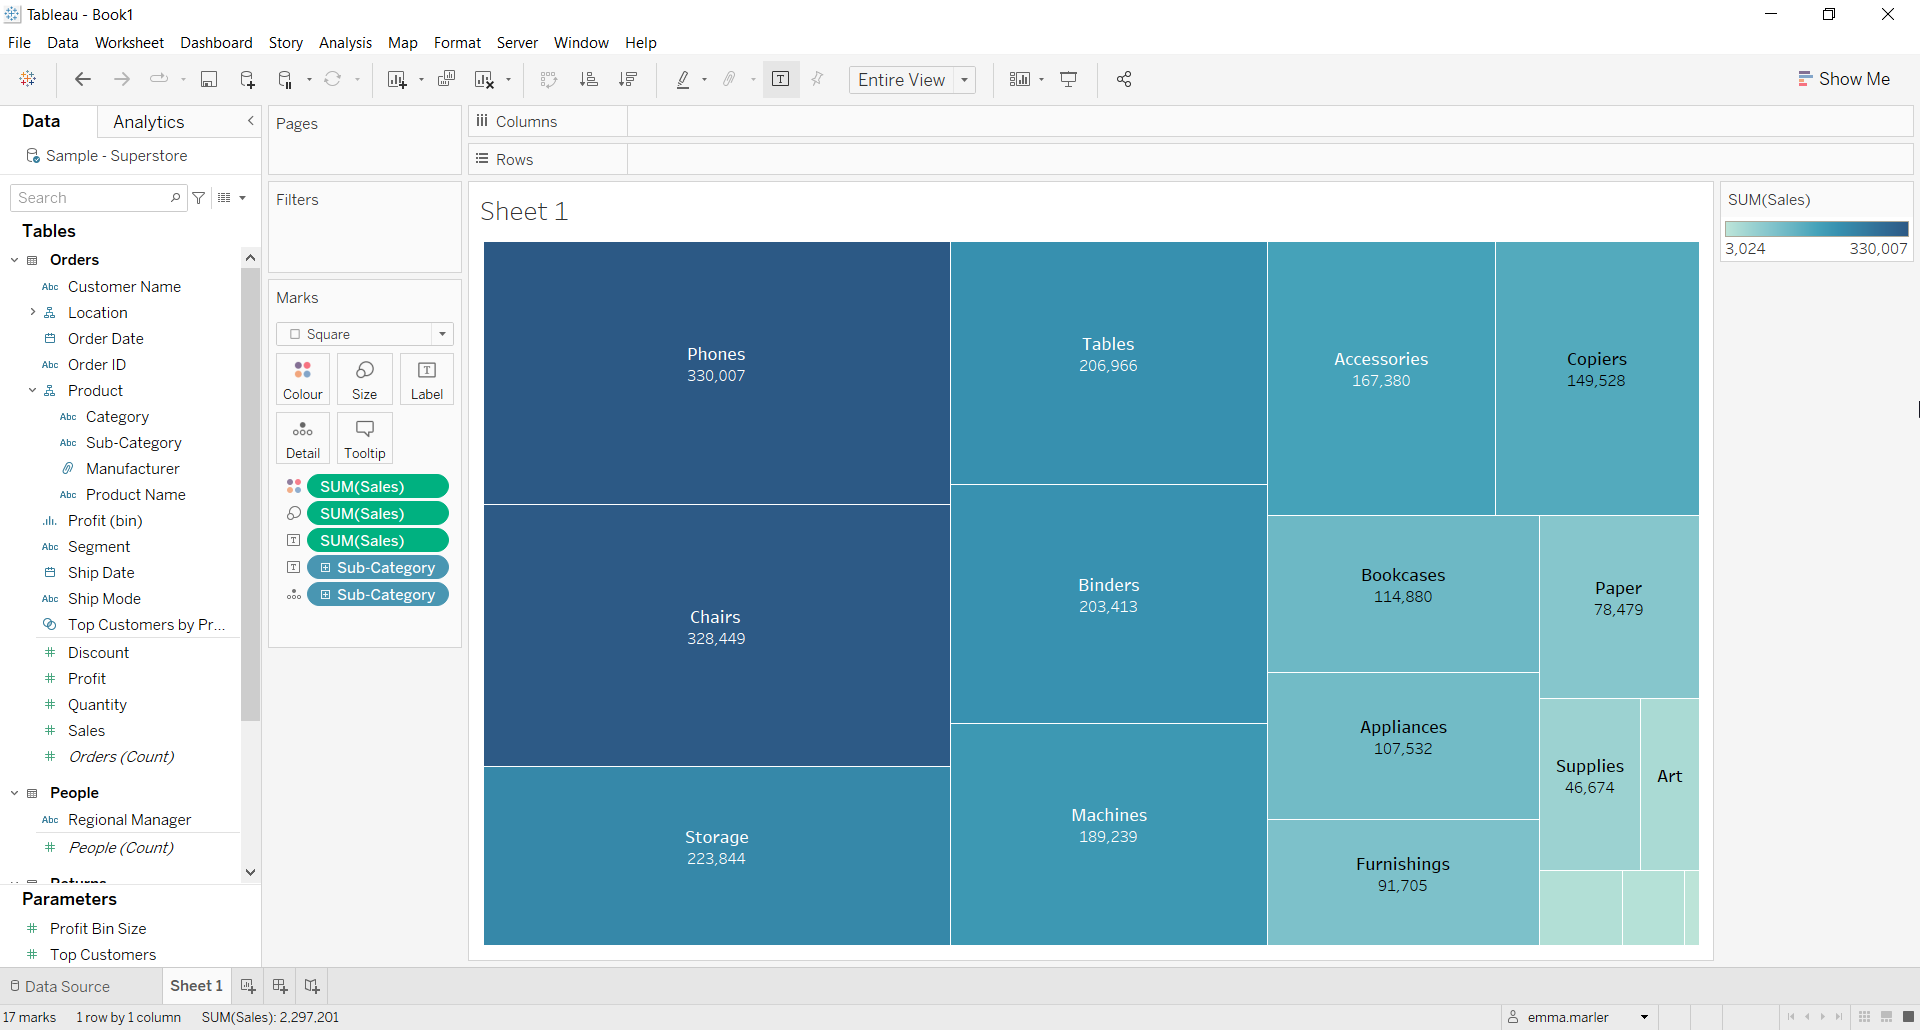
Treemaps capture relative sizes of data categories, allowing for quick understanding of the size and contribution of each item in a category. A gradient color scale can further enhance the perception of which items are largely represented in a category.
Let us then see how to build step-by-step a treemap on Tableau. Our goal is to create a treemap showing sales per sub-category of product from the Sample Superstore data.
Step 1. Create a treemap
- Connect to the data source Sample – Superstore.
- Select Square from the dropdown menu in the Marks card.
- Drag Subcategory on Detail in the Marks card.
- Drag Sales on Size in the Marks card.
- Drag Sales on Color in the Marks card.
- Drag both Sales and Subcategory on Label in the Marks card.

- Click on Label to align the information at the center, change font and so on. There you go!

Don’t wait! Contact us to learn more and continue to follow upcoming news on our website and LinkedIn channel.